Announcement

Collapse
No announcement yet.

Seasonal Flu 2008 - 2009

Collapse
X
 
  • Filter
  • Time
  • Show
Clear All
new posts

  • Re: Seasonal Flu 2008 - 2009

    <TABLE cellSpacing=0 cellPadding=0 width="100%" border=0><TBODY><TR><TD class=ContentTop width=14></TD><TD class=content><!-- INSERT THE CONTENT HERE (as a table or as simple text) --><TABLE cellSpacing=0 cellPadding=0 width="100%" border=0><TBODY><TR><TD class=categoryPath title="click here to go back to Weekly Country Report listing"> Weekly Country Report</TD><TD class=categoryPath> </TD><TD class=categoryPath align=right>Visualization of the data </TD></TR></TBODY></TABLE><TABLE cellSpacing=0 cellPadding=0 width="100%" border=0><TBODY><TR><TD class=content width="50%"> </TD><TD class=content width="50%"> </TD></TR><TR></TD><TR></TD><TR><TD class=content vAlign=top noWrap>Center Name:</TD><TD class=content>Norwegian Institute of Public Health WHO National Influenza Centre</TD><TR><TD class=content vAlign=top noWrap>Country:</TD><TD class=content>Norway</B></TD></TD><TR><TD class=content vAlign=top noWrap>Week No:</TD><TD class=content>44</TD><TR><TD class=content vAlign=top noWrap>Date From:</TD><TD class=content>10/26/2008</TD><TR><TD class=content vAlign=top noWrap>Date To:</TD><TD class=content>11/1/2008</TD><TR><TD class=content vAlign=top noWrap>WCR:</TD><TD class=content>One case of influenza A(H1N1) virus infection, patient returning from travel abroad (USA). No indication of indigenous circulation of influenza viruses.</TD><TR><TD class=content width="50%"> </TD><TD class=content width="50%"> </TD></TR></TBODY></TABLE></TD></TR></TBODY></TABLE>

    Comment


    • Re: Seasonal Flu 2008 - 2009

      <TABLE width="100%" border=0><TBODY><TR><TD class=content vAlign=top>Tunisia</TD><TD class=content vAlign=top align=middle>46</TD><TD class=content vAlign=top>11/9/2008</TD><TD class=content vAlign=top>Second sporadic case in Tunis in two weeks</TD><TD class=content vAlign=top>View</TD></TR><TR><TD class=content vAlign=top>Tunisia</TD><TD class=content vAlign=top align=middle>45</TD><TD class=content vAlign=top>11/2/2008</TD><TD class=content vAlign=top>Sporadic case of A/H1 discovered in Tunis</TD><TD class=content vAlign=top>View</TD></TR></TBODY></TABLE>

      Comment


      • Re: Seasonal Flu 2008 - 2009

        EISS - Weekly Electronic Bulletin Week 45 : 03/11/2008-09/11/2008 - 14 November 2008, Issue N. 279 Continuing low levels of influenza activity in Europe - more countries reporting virus detections
        EISS - Weekly Electronic Bulletin Week 45 : 03/11/2008-09/11/2008 - 14 November 2008, Issue N. 279 Continuing low levels of influenza activity in Europe - more countries reporting virus detections

        ? Summary:

        Levels of influenza activity were low in all European countries reporting data in week 45/2008.

        Since week 40/2008, sporadic laboratory-confirmed cases of influenza have been reported from 15 countries across Europe.


        ? Epidemiological situation - week 45/2008:

        For the intensity indicator, the national network levels of influenza-like illness (ILI) and/or acute respiratory infection (ARI) were low in all the 26 countries providing data.

        For the geographical spread indicator, sporadic influenza activity was reported in England, Ireland, Northern Ireland, Norway and Portugal and no activity in 21 countries.


        ? Cumulative epidemiological situation - 2008-2009 season (weeks 40-45/2008):

        So far this season, the consultation rates for ILI and/or ARI are at levels usually seen outside the winter period (i.e. below the national baseline threshold).


        ? Virological situation - week 45/2008:

        The total number of respiratory specimens collected by sentinel physicians in week 45/2008 was 273, of which 17 (6.2%) were influenza virus positive; 16 type A (12 subtype H3, one subtype H1 and three not subtyped), and one type B.

        In addition, 24 influenza virus detections were reported from non-sentinel sources (e.g. specimens collected for diagnostic purposes in hospitals); 22 type A (two subtype H1 and 20 not subtyped), and two type B.

        Detection of influenza viruses was reported from ten countries across Europe, which, with two exceptions, were located along the western borders of Europe (England, Ireland, Northern Ireland, Norway, Portugal, Romania, Spain, Sweden, Switzerland, Wales).


        ? Cumulative virological situation - 2008-2009 season (weeks 40-45/2008):

        Of virus detections since week 40/2008, (N=125, sentinel and non-sentinel data), 111 were type A (39 subtype H3, 15 subtype H1 and 57 not subtyped), and 14 were type B.

        Based on the antigenic and/or genetic characterisation of 23 influenza viruses, six were reported as A/Brisbane/59/2007 (H1N1)-like, 14 as A/Brisbane/10/2007 (H3N2)-like, one as B/Florida/4/2006-like (B/Yamagata/16/88 lineage) and two as B/Malaysia/2506/2004-like (B/Victoria/2/87 lineage).

        Analyses of antiviral susceptibility by genetic or phenotypic methods have been reported for nine influenza viruses, five A(H1N1) and three A(H3N2) from the UK and one A(H1N1) from Norway.

        Five of the six A(H1N1) viruses were shown to be resistant to oseltamivir (4 from the UK and 1 from Norway) and one to be sensitive; all those tested against zanamivir (4) and amantadine (2) were shown to be sensitive.

        The two A(H3N2) viruses tested against amantadine were shown to be resistant; all three A(H3N2) viruses were shown to be sensitive to oseltamivir and zanamivir.


        ? Comment:

        An increasing number of countries reported sporadic influenza virus detection compared to previous weeks, although this was not accompanied by significant increases in consultation rates.

        Most of the countries (11/15) in which influenza viruses have been detected since week 40/2008 are located along the western borders of Europe.

        The majority (89%; 111/125) of virus detections have been type A and 72% (39/54) of those subtyped were shown to be H3. It is too soon, however, to conclude which virus type or subtype may become dominant in Europe this season.

        Similarly, limited data are available on antiviral resistance and although most (5/6) of the A(H1N1) viruses analysed to date are oseltamivir-resistant it is too early to comment on the resistance pattern for Europe as a whole.

        Whilst influenza activity in Europe is currently low, reports of RSV (respiratory syncytial virus), a respiratory virus with clinical symptoms similar to influenza, are increasing in several countries in Europe that report RSV detections to EISS, notably for the UK (e.g. England and Northern Ireland), Ireland and the the Netherlands. The increase in RSV detections at this time of the year is a normal phenomenon in these countries.


        ? Background:

        The Weekly Electronic Bulletin presents and comments on influenza activity in the 30 European countries that are members of EISS.

        In week 45/2008, 26 countries reported clinical data and 24 countries reported virological data to EISS.

        The spread of influenza virus strains and their epidemiological impact in Europe are being monitored by EISS under the aegis of the European Centre for Disease Prevention and Control in Stockholm (Sweden) in collaboration with the WHO Collaborating Centre in London (United Kingdom).


        ? Map

        The map presents the intensity of influenza activity and the geographical spread as assessed by each of the networks in EISS.

        <table style="width: auto;"><tbody><tr><td></td></tr><tr><td style="font-family: arial,sans-serif; font-size: 11px; text-align: right;">From MAPS</td></tr></tbody></table>
        <table style="width: auto;"><tbody><tr><td></td></tr><tr><td style="font-family: arial,sans-serif; font-size: 11px; text-align: right;">From MAPS</td></tr></tbody></table>

        Europe Year 2008 / Week 45

        A = Dominant virus A
        H1N1 = Dominant virus A(H1N1)
        H3N2 = Dominant virus A(H3N2)
        H1N2 = Dominant virus A(H1N2)
        B = Dominant virus B
        A & B = Dominant virus A & B

        = : stable clinical activity
        + : increasing clinical activity
        - : decreasing clinical activity

        Low = no influenza activity or influenza at baseline levels
        Medium = usual levels of influenza activity
        High = higher than usual levels of influenza activity
        Very high = particularly severe levels of influenza activity

        No activity = no evidence of influenza virus activity (clinical activity remains at baseline levels)Sporadic = isolated cases of laboratory confirmed influenza infection
        Local outbreak = increased influenza activity in local areas (e.g. a city) within a region,or outbreaks in two or more institutions (e.g. schools) within a region. Laboratory confirmed.
        Regional activity = influenza activity above baseline levels in one or more regions witha population comprising less than 50% of the country's total population. Laboratory confirmed.
        Widespread = influenza activity above baseline levels in one or more regions with a populationcomprising 50% or more of the country's population. Laboratory confirmed.

        Finland : Where available, the epidemiological data are provided by a health-care district in South-Western Finland (the health-care district serves 54,000 inhabitants i.e. approximately onepercent of the Finnish population).


        ? Network comments (where available)

        - Norway
        One case of influenza A detected by a laboratory in Northern Norway

        - Spain
        Sporadic AH3 isolates in the North of Spain
        -
        <cite cite="http://www.eiss.org/cgi-files/bulletin_v2.cgi">EISS - Bulletin Review</cite>

        Comment


        • Re: Seasonal Flu 2008 - 2009

          Commentary

          Comment


          • Re: Seasonal Flu 2008 - 2009

            2008-2009 Influenza Season Week 45, ending November 8, 2008
            (All data are preliminary and may change as more reports are received.)
            Synopsis:

            During week 45 (November 2-8, 2008), a low level of influenza activity was reported in the United States.
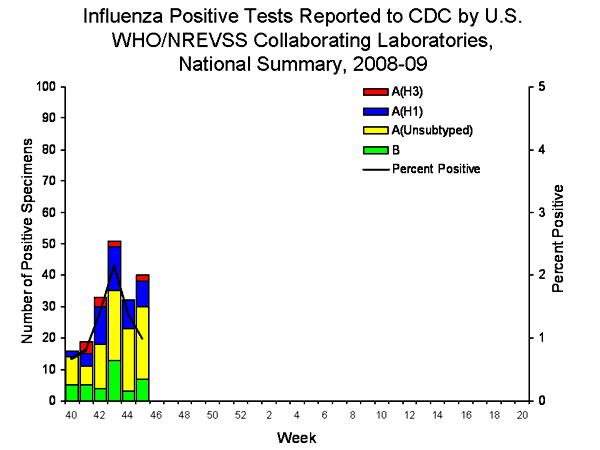
            • Forty (1.7%) specimens tested by U.S. World Health Organization (WHO) and National Respiratory and Enteric Virus Surveillance System (NREVSS) collaborating laboratories, and reported to CDC/Influenza Division, were positive for influenza.
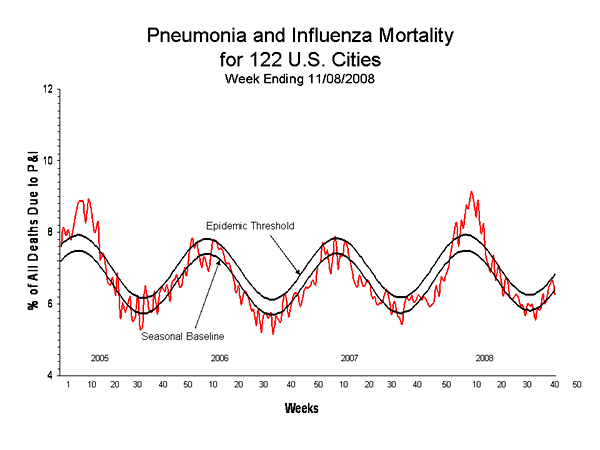
            • The proportion of deaths attributed to pneumonia and influenza (P&I) was below the epidemic threshold.
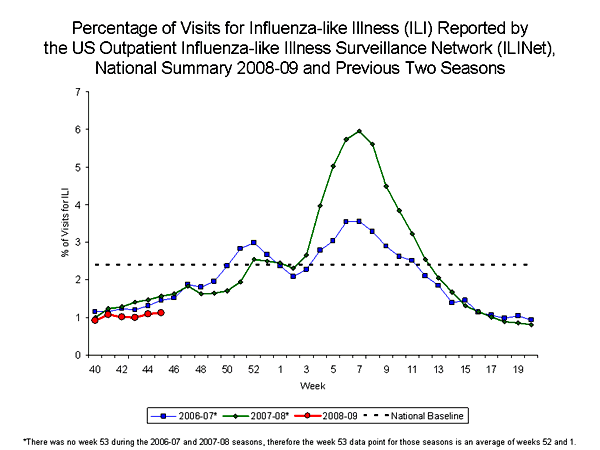
            • The proportion of outpatient visits for influenza-like illness (ILI) was below national and region-specific baseline levels.
            • One state reported local influenza activity; 15 states and Puerto Rico reported sporadic influenza activity; 34 states and the District of Columbia reported no influenza activity.
            <TABLE class=table cellSpacing=0 cellPadding=3 align=center border=0><CAPTION>National and Regional Summary of Select Surveillance Components

            </CAPTION><TBODY><TR vAlign=top><TH vAlign=bottom width=85 rowSpan=2>
            Region
            </TH><TH noWrap align=middle width=300 colSpan=3>Data for current week</STRONG></TH><TH noWrap align=middle width=276 colSpan=5>Data cumulative for the season</TH></TR><TR vAlign=top><TH align=middle width=72>Out-patient ILI*</TH><TH align=middle width=72>% positive for flu?</TH><TH align=middle width=96>Number of jurisdictions reporting regional or widespread activity?</TH><TH noWrap align=middle width=48>A (H1)</TH><TH noWrap align=middle width=48>A (H3)</TH><TH align=middle width=60>A Unsub-typed</TH><TH noWrap align=middle width=48>B</TH><TH align=middle width=72>Pediatric Deaths</TH></TR><TR><TD align=left width=85>Nation</TD><TD noWrap align=middle width=72>Normal</TD><TD noWrap align=middle width=72>1.7 % </TD><TD noWrap align=middle width=96>0 of 51 </TD><TD noWrap align=middle width=48>49</TD><TD noWrap align=middle width=48>11</TD><TD noWrap align=middle width=60>94</TD><TD noWrap align=middle width=48>37</TD><TD noWrap align=middle width=72>0</TD></TR><TR><TD align=left width=85>New England</TD><TD noWrap align=middle width=72>Normal</TD><TD noWrap align=middle width=72>0.3 % </TD><TD noWrap align=middle width=96>0 of 6</TD><TD noWrap align=middle width=48>0</TD><TD noWrap align=middle width=48>1</TD><TD noWrap align=middle width=60>0</TD><TD noWrap align=middle width=48>1</TD><TD noWrap align=middle width=72>0</TD></TR><TR><TD align=left width=85>Mid-Atlantic</TD><TD noWrap align=middle width=72>Normal</TD><TD noWrap align=middle width=72>0.3 % </TD><TD noWrap align=middle width=96>0 of 3</TD><TD noWrap align=middle width=48>1</TD><TD noWrap align=middle width=48>0</TD><TD noWrap align=middle width=60>2</TD><TD noWrap align=middle width=48>0</TD><TD noWrap align=middle width=72>0</TD></TR><TR><TD align=left width=85>East North Central</TD><TD noWrap align=middle width=72>Normal</TD><TD noWrap align=middle width=72>3.3 % </TD><TD noWrap align=middle width=96>0 of 5</TD><TD noWrap align=middle width=48>1</TD><TD noWrap align=middle width=48>0</TD><TD noWrap align=middle width=60>3</TD><TD noWrap align=middle width=48>2</TD><TD noWrap align=middle width=72>0</TD></TR><TR><TD align=left width=85>West North Central</TD><TD noWrap align=middle width=72>Normal</TD><TD noWrap align=middle width=72>0.3 % </TD><TD noWrap align=middle width=96>0 of 7</TD><TD noWrap align=middle width=48>0</TD><TD noWrap align=middle width=48>0</TD><TD noWrap align=middle width=60>2</TD><TD noWrap align=middle width=48></TD><TD noWrap align=middle width=72>0</TD></TR><TR><TD align=left width=85>South Atlantic</TD><TD noWrap align=middle width=72>Normal</TD><TD noWrap align=middle width=72>1.8 % </TD><TD noWrap align=middle width=96>0 of 9</TD><TD noWrap align=middle width=48>3</TD><TD noWrap align=middle width=48>2</TD><TD noWrap align=middle width=60>28</TD><TD noWrap align=middle width=48>11</TD><TD noWrap align=middle width=72>0</TD></TR><TR><TD align=left width=85>East South Central</TD><TD noWrap align=middle width=72>Normal</TD><TD noWrap align=middle width=72>0.0 % </TD><TD noWrap align=middle width=96>0 of 4</TD><TD noWrap align=middle width=48>0</TD><TD noWrap align=middle width=48>0</TD><TD noWrap align=middle width=60>0</TD><TD noWrap align=middle width=48>0</TD><TD noWrap align=middle width=72>0</TD></TR><TR><TD align=left width=85>West South Central</TD><TD noWrap align=middle width=72>Normal</TD><TD noWrap align=middle width=72>2.8 % </TD><TD noWrap align=middle width=96>0 of 4</TD><TD noWrap align=middle width=48>5</TD><TD noWrap align=middle width=48>0</TD><TD noWrap align=middle width=60>18</TD><TD noWrap align=middle width=48>11</TD><TD noWrap align=middle width=72>0</TD></TR><TR><TD align=left width=85>Mountain</TD><TD noWrap align=middle width=72>Normal</TD><TD noWrap align=middle width=72>0.6 % </TD><TD noWrap align=middle width=96>0 of 8</TD><TD noWrap align=middle width=48>0</TD><TD noWrap align=middle width=48>6</TD><TD noWrap align=middle width=60>5</TD><TD noWrap align=middle width=48>3</TD><TD noWrap align=middle width=72>0</TD></TR><TR><TD align=left width=85>Pacific</TD><TD noWrap align=middle width=72>Normal</TD><TD noWrap align=middle width=72>3.6 % </TD><TD noWrap align=middle width=96>0 of 5</TD><TD noWrap align=middle width=48>39</TD><TD noWrap align=middle width=48>2</TD><TD noWrap align=middle width=60>36</TD><TD noWrap align=middle width=48>8</TD><TD noWrap align=middle width=72>0</TD></TR></TBODY></TABLE>
            * Elevated means the % of visits for ILI is at or above the national or region-specific baseline
            ? National data is for current week; regional data is for the most recent three weeks.
            ? Includes all 50 states and the District of Columbia
            U.S. Virologic Surveillance:

            During week 45, WHO and NREVSS laboratories located in all 50 states and Washington D.C. reported 2,332 specimens tested for influenza viruses, 40 of which were positive: eight influenza A (H1) viruses, two influenza A (H3) viruses, 23 influenza A viruses that were not subtyped, and seven influenza B viruses. Twenty-one states from eight of the nine surveillance regions have reported laboratory-confirmed influenza this season.
            <CENTER>
            View WHO-NREVSS Regional Bar Charts| View Chart Data | View Full Screen </CENTER>Antigenic Characterization:

            CDC has antigenically characterized one influenza virus collected by U.S. laboratories since October 1, 2008. The influenza B virus was characterized as B/Florida/04/2006-like, belonging to the B/Yamagata lineage. Influenza B viruses currently circulating can be divided into two antigenically distinct lineages represented by the B/Yamagata/16/88 and B/Victoria/02/87 viruses. The recommended influenza B component for the 2008-09 influenza vaccine is a B/ Florida/04/2006-like viruses, belonging to the B/Yamagata lineage.
            In addition, a small number of isolates from specimens collected during September were available for antigenic characterization: one influenza A (H1N1), two influenza A (H3N2), and four influenza B viruses. The influenza A (H1N1) specimen is antigenically close to A/Brisbane/59/2007, the influenza A (H1N1) component of the 2008-09 influenza vaccine. All six other viruses were antigenically similar to the components selected for the 2008-09 influenza vaccine (A/Brisbane/10/2007-like (H3N2) and B/Florida/04/2006-like).
            It is too early in the influenza season to determine which influenza viruses will predominate or how well the vaccine and circulating strains will match.
            Antigenic Characterization:

            In the United States, two groups of antiviral drugs have been approved by FDA for use in treating or preventing influenza virus infections. These two groups of antiviral drugs are neuraminidase inhibitors (oseltamivir and zanamivir) and adamantanes (amantadine and rimantadine). A description of these drugs can be found at: http://www.cdc.gov/flu/protect/antiviral/index.htm.
            • Neuraminidase Inhibitor Antiviral Drugs: Since October 1, 2008, one influenza A (H1N1), one influenza A (H3N2), and one influenza B virus have been tested for antiviral resistance. In addition, CDC performed antiviral resistance testing on one influenza A (H1N1), three influenza A (H3N2), and four influenza B viruses collected during September. All tested viruses are sensitive to both oseltamivir and zanamivir.
              Adamantane Antiviral Drugs: A small number of isolates from specimens collected during September were tested for adamantane resistance. The one influenza A (H1N1) virus tested and the two influenza A (H3N2) viruses tested were resistant to the adamantanes. The adamantanes are not effective against influenza B viruses.
              Additional information on antiviral resistance can be found at: http://www.cdc.gov/flu/about/qa/antiviralresistance.htm
              Based on the level of oseltamivir resistance observed in only one influenza subtype, H1N1, and the persisting high levels of resistance to the adamantanes in H3N2 viruses, CDC continues to recommend the use of oseltamivir and zanamivir for the treatment or prevention of influenza. Use of amantadine or rimantadine is not recommended. Guidance on influenza antiviral use can be found at: http://www.cdc.gov/mmwr/preview/mmwrhtml/rr57e717a1.htm
            Pneumonia and Influenza (P&I) Mortality Surveillance

            During week 45, 6.3% of all deaths reported through the 122-Cities Mortality Reporting System were due to P&I. This percentage is below the epidemic threshold of 6.8% for week 45.
            <CENTER>
            View Full Screen</CENTER>Influenza-Associated Pediatric Mortality

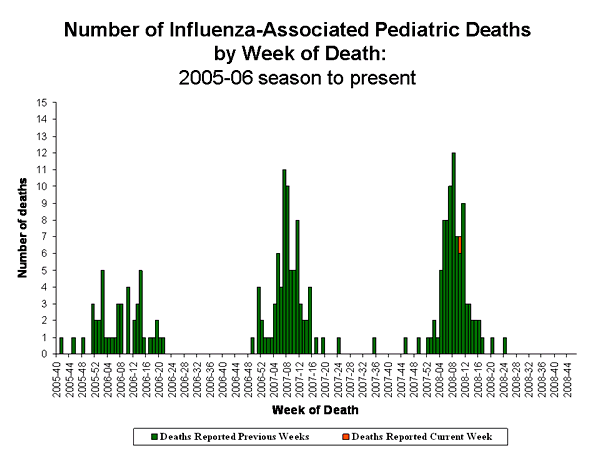
            No pediatric deaths have been reported for the 2008-09 season. One influenza-associated pediatric death was reported during week 45 from Washington. This death occurred during the 2007-08 season and brings the total number of reported pediatric deaths occurring during that season to 88.
            <CENTER>
            View Full Screen</CENTER>Influenza-Associated Hospitalizations

            Laboratory-confirmed influenza-associated hospitalizations are monitored in two population-based surveillance networks: the Emerging Infections Program (EIP) and the New Vaccine Surveillance Network (NVSN). EIP and NVSN estimated rates of hospitalization for influenza will be reported every two weeks starting later this season.
            Outpatient Illness Surveillance:

            During week 45, 1.1% of patient visits reported through the U.S. Outpatient Influenza-like Illness Surveillance Network (ILINet) (formerly known as the U.S. Influenza Sentinel Provider Surveillance Network) were due to influenza-like illness (ILI). This percentage is less than the national baseline of 2.4%. On a regional level, the percentage of visits for ILI ranged from 0.4% to 1.7%. All nine regions reported percentages of visits for ILI below their respective region-specific baselines.
            <CENTER>
            View Sentinel Providers Regional Charts | View Chart Data |View Full Screen
            </CENTER>Geographic Spread of Influenza as Assessed by State and Territorial Epidemiologists:


            During week 45 the following influenza activity was reported:
            • Local influenza activity was reported in one state (Hawaii).
            • Sporadic activity was reported in Puerto Rico and 15 states (Alaska, California, Colorado, Connecticut, Idaho, Illinois, Indiana, Massachusetts, Nevada, New York, Pennsylvania, Texas, Utah, Wisconsin, and Wyoming).
            • No influenza activity was reported in the District of Columbia and 34 states (Alabama, Arizona, Arkansas, Delaware, Florida, Georgia, Iowa, Kansas, Kentucky, Louisiana, Maine, Maryland, Michigan, Minnesota, Mississippi, Missouri, Montana, Nebraska, New Hampshire, New Jersey, New Mexico, North Carolina, North Dakota, Ohio, Oklahoma, Oregon, Rhode Island, South Carolina, South Dakota, Tennessee, Vermont, Virginia, Washington, and West Virginia).

            <OBJECT id=Banner height=420 width="100%" classid=clsid27CDB6E-AE6D-11cf-96B8-444553540000>


            </OBJECT>
            <SCRIPT type=text/javascript> var stamp = new Date() var movieurl = "/flu/weekly/smallmap/SmallFluActivity_v2.swf?c=FluMap&n=" + stamp.getTime(); var so = new SWFObject(movieurl, "Banner", "100%", "420", "7"); so.write("flashALTcontent"); so.addParam("scale", "noorder"); so.addParam("allowScriptAccess","sameDomain"); so.addParam("wmode", "transparent"); so.addParam("quality", "best"); so.addParam("salign", "r"); so.addParam("type", "application/x-shockwave-flash"); </SCRIPT>
            --------------------------------------------------------------------------------
            A description of surveillance methods is available at: http://www.cdc.gov/flu/weekly/fluactivity.htm
            <SCRIPT type=text/javascript> <!-- function popupnr(mylink, windowname, refocus) { var mywin, href; if (typeof(mylink) == 'string') href=mylink; else href=mylink.href; mywin = window.open('', windowname, 'width=450,height=550,scrollbars=yes'); // if opened the window if ( mywin.closed || (! mywin.document.URL) || (mywin.document.URL.indexOf("about") == 0) ) mywin.location=href; else if (refocus) mywin.focus(); return false; } //--> </SCRIPT>

            Comment


            • Re: Seasonal Flu 2008 - 2009

              Most of the subtyped influenza A is H1N1, but most is in the Pacific (and most of the Pacific appears to be Hawaii). The Pacific is likely to have clade 2B (Brisbane) and clade 2C (Hong Kong), but it is not clear that the CDC is distinguishing between the two subclades. Reported Tamiflu resistance results is VERY limited.

              Comment


              • Re: Seasonal Flu 2008 - 2009

                <TABLE cellSpacing=0 cellPadding=0 width="100%" border=0><TBODY><TR><TD>November 2, 2008 to November 8, 2008 (Weeks 45)

                </TD></TR></TBODY></TABLE><!-- ################################################# --><!-- START Menu container | DEBUT de conteneur du menu --><!-- FlUWATCH 2008-2009 RIGHT NAV SSI START --><!-- SIDE MENU TITLE BEGINS | DEBUT DU TITRE DU MENU LATERAL --><!-- ################################################## ########################## --><!-- START right Navigation container FlUWATCH | DEBUT du conteneur de la navigation droit Surveillance de l'influenza-->
                <!-- START expandable header | DEBUT de l'en-t&ecirc;te extensible --><!-- END expandable header | FIN de l'en-t&ecirc;te extensible --><!-- START expandable content | DEBUT du contenu extensible -->Fluwatch


                <!-- Start Submenu -->
                • <A class=nav href="http://www.phac-aspc.gc.ca/fluwatch/08-09/w45_08/index-eng.php#map"><ACRONYM title="Influenza-like illness">ILI</ACRONYM> activity by province

                Other information


                <!-- END expandable content | FIN du contenu extensible --><!-- START footer | DEBUT le bas de la bo&icirc;te --><!-- -->

                <!-- END footer | FIN le bas de la bo&icirc;te -->
                <!-- END right Navigation container FlUWATCH| FIN du conteneur de la navigation droit Surveillance de l'influenza --><!-- ################################################## ###################### --><!-- FlUWATCH RIGHT SSI END --><!-- END Menu container | FIN de conteneur du menu --><!-- ############################################# --><!-- CONTENT TITLE BEGINS | DEBUT DU TITRE DU CONTENU -->PDF Version

                Low levels of influenza activity continue to be reported in Canada; slight increases in lab detections and ILI consultation rates reported this week
                During week 45, influenza activity in Canada remained low with the majority of the influenza surveillance regions reporting no activity and only six regions (in BC, AB, ON & QC ) reported sporadic influenza activity (see map). Seven specimens tested positive for influenza in Canada this week (percentage positive = 0.5%; 7/1,512) (see table). In week 45, the ILI consultation rate increased to 11 ILI consultations per 1,000 patient visits (see ILI graph), and is below the expected range for this week. The sentinel response rate remained low at 42%; however, sentinel participation is expected to increase as the influenza season progresses. Fluctuations in ILI consultation rates are expected during periods of low influenza activity and low sentinel participation. No new influenza outbreaks were reported in week 45.

                Antigenic Characterization & Antiviral Resistance:
                Since 1 September 2008, National Microbiology Laboratory (NML) has antigenically characterized five influenza viruses: one influenza A/Brisbane/10/2007(H3N2)-like (from BC), one influenza A/Brisbane/59/2007(H1N1)-like (from NS), two influenza B/Florida/4/2006-like (from ON and AB) and one B/Malaysia/2506/2004-like (from AB). A/Brisbane/10/2007(H3N2), A/Brisbane/59/2007(H1N1) and B/Florida/4/2006 are the influenza A and influenza B components recommended for the 2008-09 influenza vaccine. B/Malaysia/2506/2004 was the influenza B component for the 2007-2008 season vaccine (see pie chart).
                Antiviral Resistance:
                Since the start of the season, the NML has tested 2 influenza A isolates (1 H1N1 and 1 H3N2) for amantadine resistance and found that the H3N2 isolate was resistant to amantadine and the H1N1 isolate was susceptible; resulting in 50% (1/2) resistance among all influenza A isolates tested.
                The NML has also tested 5 influenza isolates (1 A/H1N1, 1 A/H3N2 & 3 B) for oseltamivir (Tamiflu) resistance and found that the H1N1 isolate tested was resistant to oseltamivir due to the H274Y mutation whereas the H3N2 and B isolates were susceptible; resulting in 20% (1/5) resistance among all influenza isolates tested.
                Influenza-associated Paediatric Hospitalizations:
                No laboratory-confirmed influenza-associated paediatric hospitalizations have been reported through the Immunization Monitoring Program Active (IMPACT) network for the 2008-09 season.
                International:

                <!-- WHO: Influenza activity in the southern hemisphere continued to decline in weeks 43-44. Activity was low elsewhere, with some countries reporting sporadic activity.
                • <a href="http://www.who.int/csr/disease/influenza/update/en/" rel="x"><acronym title="World Health Organization">WHO</acronym>
                -->CDC: During week 44, a low level of influenza activity was reported in the United States with the majority of the states reporting no activity and several more states reporting sporadic activity compared to the previous week. Of the 1,780 specimens tested this week for influenza viruses, 11 (0.6%) were positive. Since 1 October 2008, the CDC has antigenically characterized one influenza virus: B/Florida/04/2006-like.
                • <A href="http://www.cdc.gov/flu/weekly/" target=_blank rel=x><ACRONYM title="Centers for Disease Control and Prevention ">CDC</ACRONYM>
                EISS: Levels of influenza activity were low in all European countries, however an increasing number of countries reported sporadic influenza virus detections compared to previous weeks. The majority (89%) of virus detections have been influenza A and 72% of those subtyped were shown to be A/H3. Limited data are available on antiviral resistance: 83% (5/6) of the influenza A(H1N1) viruses analysed to date are resistant to oseltamivir. Note that reports of RSV detections are increasing in several countries in Europe; however the increase in those countries is normal at this time of the year.
                • <A href="http://www.eiss.org/cgi-files/bulletin_v2.cgi" target=_blank rel=x><ACRONYM title=" European Influenza Surveillance Scheme">EISS</ACRONYM>
                Human Avian Influenza: No new cases of human H5N1 avian influenza infection have been reported by the WHO since 10 September 2008.
                • <A href="http://www.who.int/csr/disease/avian_influenza/en/index.html" target=_blank rel=x><ACRONYM title="World Health Organization">WHO</ACRONYM>
                <HR>Total number of influenza tests performed and number of positive tests by province/territory of testing laboratory, Canada, 2008-2009

                <TABLE id=fluwatchtable cellSpacing=0 cellPadding=2 width="100%" border=1><TBODY><TR class=bg-colour-blue vAlign=top><TD class=alignCenter rowSpan=3>Province of
                reporting
                laboratories
                </TD><TD class=alignCenter vAlign=bottom colSpan=4>Report Period:
                November 2, 2008 to November 8, 2008
                </TD><TD class=alignCenter vAlign=bottom colSpan=4>Season to Date:
                August 24, 2008 to November 8, 2008
                </TD></TR><TR class=bg-colour-blue><TD class=alignCenter rowSpan=2>Total #
                Influenza
                Tests
                </TD><TD class=alignCenter colSpan=3># of Positive Tests </TD><TD class=alignCenter rowSpan=2>Total #
                Influenza
                Tests
                </TD><TD class=alignCenter colSpan=3># of Positive Tests </TD></TR><TR class=bg-colour-blue vAlign=top><TD class=alignCenter vAlign=center>Influenza A</TD><TD class=alignCenter vAlign=center>Influenza B</TD><TD class=alignCenter vAlign=center>Total </TD><TD class=alignCenter vAlign=center>Influenza A</TD><TD class=alignCenter vAlign=center>Influenza B</TD><TD class=alignCenter vAlign=center>Total </TD></TR><TR><TD class=bg-colour-blue>NL
                </TD><TD class=alignCenter>7</TD><TD class=alignCenter>0</TD><TD class=alignCenter>0</TD><TD class=alignCenter>0</TD><TD class=alignCenter>57</TD><TD class=alignCenter>0</TD><TD class=alignCenter>0</TD><TD class=alignCenter>0</TD></TR><TR><TD class=bg-colour-blue>PE
                </TD><TD class=alignCenter>5</TD><TD class=alignCenter>0</TD><TD class=alignCenter>0</TD><TD class=alignCenter>0</TD><TD class=alignCenter>22</TD><TD class=alignCenter>0</TD><TD class=alignCenter>0</TD><TD class=alignCenter>0</TD></TR><TR><TD class=bg-colour-blue>NS
                </TD><TD class=alignCenter>13</TD><TD class=alignCenter>0</TD><TD class=alignCenter>0</TD><TD class=alignCenter>0</TD><TD class=alignCenter>113</TD><TD class=alignCenter>1</TD><TD class=alignCenter>0</TD><TD class=alignCenter>1</TD></TR><TR><TD class=bg-colour-blue>NB
                </TD><TD class=alignCenter>4</TD><TD class=alignCenter>0</TD><TD class=alignCenter>0</TD><TD class=alignCenter>0</TD><TD class=alignCenter>50</TD><TD class=alignCenter>0</TD><TD class=alignCenter>0</TD><TD class=alignCenter>0</TD></TR><TR><TD class=bg-colour-blue>QC
                </TD><TD class=alignCenter>419</TD><TD class=alignCenter>4</TD><TD class=alignCenter>0</TD><TD class=alignCenter>4</TD><TD class=alignCenter>2652</TD><TD class=alignCenter>11</TD><TD class=alignCenter>1</TD><TD class=alignCenter>12</TD></TR><TR><TD class=bg-colour-blue>ON
                </TD><TD class=alignCenter>441</TD><TD class=alignCenter>0</TD><TD class=alignCenter>0</TD><TD class=alignCenter>0</TD><TD class=alignCenter>3488</TD><TD class=alignCenter>0</TD><TD class=alignCenter>2</TD><TD class=alignCenter>2</TD></TR><TR><TD class=bg-colour-blue>MB
                </TD><TD class=alignCenter>45</TD><TD class=alignCenter>0</TD><TD class=alignCenter>0</TD><TD class=alignCenter>0</TD><TD class=alignCenter>434</TD><TD class=alignCenter>0</TD><TD class=alignCenter>0</TD><TD class=alignCenter>0</TD></TR><TR><TD class=bg-colour-blue>SK
                </TD><TD class=alignCenter>73</TD><TD class=alignCenter>0</TD><TD class=alignCenter>0</TD><TD class=alignCenter>0</TD><TD class=alignCenter>685</TD><TD class=alignCenter>0</TD><TD class=alignCenter>0</TD><TD class=alignCenter>0</TD></TR><TR><TD class=bg-colour-blue>AB
                </TD><TD class=alignCenter>469</TD><TD class=alignCenter>0</TD><TD class=alignCenter>2</TD><TD class=alignCenter>2</TD><TD class=alignCenter>3685</TD><TD class=alignCenter>1</TD><TD class=alignCenter>6</TD><TD class=alignCenter>7</TD></TR><TR><TD class=bg-colour-blue>BC
                </TD><TD class=alignCenter>36</TD><TD class=alignCenter>1</TD><TD class=alignCenter>0</TD><TD class=alignCenter>1</TD><TD class=alignCenter>279</TD><TD class=alignCenter>1</TD><TD class=alignCenter>0</TD><TD class=alignCenter>1</TD></TR><TR><TD class=bg-colour-blue>Canada
                </TD><TD class=alignCenter>1512</TD><TD class=alignCenter>5</TD><TD class=alignCenter>2</TD><TD class=alignCenter>7</TD><TD class=alignCenter>11465</TD><TD class=alignCenter>14</TD><TD class=alignCenter>9</TD><TD class=alignCenter>23</TD></TR></TBODY></TABLE>

                Specimens from NT, YT, and NU are sent to reference laboratories in other provinces.
                Note: Cumulative data includes updates to previous weeks; due to reporting delays, the sum of weekly report totals do not add up to cumulative totals.
                Abbreviations: Newfoundland/Labrador (NL), Prince Edward Island (PE), New Brunswick (NB), Nova Scotia (NS), Quebec (QC), Ontario (ON), Manitoba (MB), Saskatchewan (SK), Alberta (AB), British Columbia (BC), Yukon (YT), Northwest Territories (NT), Nunavut (NU)
                Respiratory virus laboratory detections in Canada, by geographic regions, are available weekly on the following website:
                <http://www.phac-aspc.gc.ca/bid-bmi/dsd-dsm/rvdi-divr/index-eng.php>


                Number of influenza surveillance regions? reporting widespread or localized influenza activity, Canada, by report week, 2008-2009 (N=54)


                ? sub-regions within the province or territory as defined by the provincial/territorial epidemiologist. Graph may change as late returns come in.


                <TABLE width="100%"><TBODY><TR vAlign=top align=middle><TD colSpan=2>Influenza Activity Level by Provincial and Territorial
                Influenza Surveillance Regions, Canada,
                November 2, 2008 to November 8, 2008 (Week 45)


                </TD></TR><TR vAlign=top align=middle><TD class=alignCenter>
                </TD><TD><TABLE cellSpacing=0 cellPadding=1 border=0><TBODY><TR><TD align=middle><TABLE class=border-lite cellSpacing=1 cellPadding=1><TBODY><TR align=middle><TD>No Data </TD><TD></TD></TR><TR align=middle><TD>No Activity</TD><TD></TD></TR><TR align=middle><TD>Sporadic Activity</TD><TD></TD></TR><TR align=middle><TD>Localized Activity</TD><TD></TD></TR><TR align=middle><TD>Widespread
                Activity
                </TD><TD></TD></TR></TBODY></TABLE></TD></TR></TBODY></TABLE></TD></TR></TBODY></TABLE>
                Note: Influenza activity levels, as represented on this map, are assigned and reported by Provincial and Territorial Ministries of Health, based on laboratory confirmations, sentinel ILI rates (see graphs and tables) and outbreaks. Please refer to detailed definitions. For areas where no data is reported, late reports from these provinces and territories will appear on the FluWatch website. Select single maps by report week to get this updated information.
                <http://dsol-smed.phac-aspc.gc.ca/dsol-smed/fluwatch/fluwatch.phtml?lang=e>
                Click on the map to view provinces/territories and maps for other weeks.


                Influenza tests reported and percentage of tests positive, Canada, by report week, 2008-2009


                Percent positive influenza tests, compared to other respiratory viruses, Canada, by reporting week, 2008-2009


                Influenza strain characterization, Canada, cumulative, 2008-2009 influenza season by the Respiratory Viruses Section at the National Microbiology Laboratory
                [N=5]


                {Strain characterization, number identified, per cent of total number}
                NACI recommends that the trivalent vaccine for the 2008-2009 season in Canada contain A/Brisbane/59/2007 (H1N1)-like virus; an A/Brisbane/10/2007 (H3N2)-like virus; and a B/Florida/4/2006-like virus.


                Influenza-like illness (ILI) consultation rates, Canada, by report week,
                2008-2009 compared to 1996/97 through to 2006/07 seasons


                Note: No data available for mean rate in previous years for weeks 19 to 39 (1996-1997 through 2002-2003 seasons).


                Number of New Outbreaks in Long Term Care Facilities, Canada, by Report Week, 2008-2009


                Please note that the above graphs may change as late returns come in.
                Single Maps | Dual Maps | Animated Maps | FluWatch Reports
                Definitions for the 2008-2009 season
                <!-- InstanceEndEditable --><!-- CONTENT ENDS | FIN DU CONTENU --><!-- ONE COLUMN LAYOUT ENDS | FIN DE LA MISE EN PAGE D'UNE COLONNE --><!-- FOOTER BEGINS | DEBUT DU PIED DE LA PAGE -->

                Comment


                • Re: Seasonal Flu 2008 - 2009

                  ITALY. First virus isolation for the season 2008/2009.

                  Ministry of Health press update of today Nov. 18, 2008 states that isolates from three patients (two children and an adult, unvaccinated) were subtyped as belonging to A/H3N2/Brisbane1007-like strain, reference virus for this season trivalent-inactivated influenza vaccine.

                  See the post in Italian at FT: http://www.flutrackers.com/forum/sho...54&postcount=8

                  Comment


                  • Re: Seasonal Flu 2008 - 2009

                    Commentary

                    Comment


                    • Re: Seasonal Flu 2008 - 2009

                      Commentary

                      Comment


                      • Re: Seasonal Flu 2008 - 2009

                        Commentary

                        Early Dominance of H1N1 in the United States
                        Recombinomics Commentary 19:53
                        November 18, 2008

                        Based on the level of oseltamivir resistance observed in only one influenza subtype, H1N1, and the persisting high levels of resistance to the adamantanes in H3N2 viruses, CDC continues to recommend the use of oseltamivir and zanamivir for the treatment or prevention of influenza. Use of amantadine or rimantadine is not recommended.

                        The above comments from the week 45 CDC report on influenza in the US are curious. The updated report indicates over 80% of the isolates are influenza A (154/191) and over 80% of the sub-typed influenza A is H1 (49/60). Although only one H1N1 sample has been reportedly tested for oseltamivir resistance, early data from the UK, Canada, and Norway indicates that H274Y in the Brisbane strain of H1N1 will be at or near 100% (and the resistant case in Norway had traveled to the US). Thus, the use of adamantines is discouraged because resistance is near 100% for H3N2, yet H3N2 is currently only a minor population in the reported flu cases in the US. The level of H1 is five fold higher, yet the US is withholding changes in recommendations for oseltamivir usage.

                        Worldwide data from last season demonstrated that many northern countries had high levels of H274Y in H1N1. Over the summer, these levels approached or reached 100% in multiple countries in the southern hemisphere.

                        These data put surveillance systems on high alert for resistance in the current season, and initial results have indicated the concerns were justified. Moreover, the highest number of reported H1 cases is in the US, yet resistance results have been released for only one of the 49 isolates that have been sub-typed as H1.


                        Release of resistance results and associated sequences would be useful.


                        .
                        "The next major advancement in the health of American people will be determined by what the individual is willing to do for himself"-- John Knowles, Former President of the Rockefeller Foundation

                        Comment


                        • Re: Seasonal Flu 2008 - 2009

                          Commentary

                          Delayed H1N1 Tamiflu Resistance Reports in the United States
                          Recombinomics Commentary 03:05
                          November 19, 2008

                          The week 45 influenza report by the CDC this year is very similar to the same report last year. Most of the flu isolates are influenza A and the vast majority of the influenza A is H1N1. This season however, more of the influenza A isolates have been sub-typed, signaling a concern over the possibility that all or most H1N1 (especially clade 2B, Brisbane/59) will have H274Y (Tamiflu resistant). Once again most of the H1 is in the pacific region and the vast majority of the isolates from the Pacific region are H1N1 (39/41).

                          Last year most of the Hong Kong (clade 2C) were in the Pacific region, and none had H274Y. All of the resistance was in Brisbane/59 (clade 2B), but the resistance was almost exclusively in a sub-clade that was closely related to the dominant sub-clade in northern Europe. That dominant sub-clade became more dominant over the summer in the southern hemisphere, which led to frequencies at or near 100% in many countries. The initial data in the UK, Norway, and Canada support a similar high level this season in the northern hemisphere.

                          Somewhat surprisingly, the resistance of only one H1N1 isolate was reported. It was negative and was said to be Brisbane/59-like. However, the antigenic analysis is not informative, because it is likely that both clade 2B and clade 2C will be called ?Brisbane/59-like? even though the two sub-clades are readily distinguished when appropriate anti-sera is used. Last year all clade 2B and clade 2C were called ?Solomon Island-like? even though there was no Solomon Island in circulation and proper anti-sera readily distinguish between clade 2A, 2B, and 2C, which is why the vaccine this season targeted Brisbane/59 instead of Solomon Island/3, which was the H1N1 vaccine target last season.

                          Thus, it is unclear what is in circulation in the US (or anywhere else in the world), because the H1 isolates are all being called ?Brisbane/59-like? which produces a ?match? with the vaccine, regardless of whether the isolate is clade 2B or clade 2C. Phylogenetic classification would be much clearer and more useful, but the current vaccine approaches are largely base on technology that is over 50 years old and in need of a significant upgrade.

                          Moreover, the current status of clade 2B and clade 2C will be clear when sequences are released because the phylogenetic analysis is very straightforward and easily distinguishes clade 2B from clade 2C, as well as sub-clades within these larger sub-clades.

                          When the NA sequences are generated, the Tamiflu resistance frequencies will be clear, which will lead to an evaluation of the current recommendations, which includes use of oseltamivir for all influenza infections.


                          .
                          "The next major advancement in the health of American people will be determined by what the individual is willing to do for himself"-- John Knowles, Former President of the Rockefeller Foundation

                          Comment


                          • Re: Seasonal Flu 2008 - 2009

                            To date, for the season 2008/2009 in Italy have been reported six laboratory-confirmed influenza cases.

                            Three influenza A subtype A/H3N2/Brisbane1007

                            and

                            Three influenza B cases, two of them imported (Uzbekistan and Senegal).

                            See: http://www.ministerosalute.it/influe...ir17-11-08.pdf and http://www.ministerosalute.it/influe...novembre08.pdf (in Italian)

                            See at FT: http://www.flutrackers.com/forum/sho...54&postcount=8 - http://www.flutrackers.com/forum/sho...50&postcount=9 - http://www.flutrackers.com/forum/sho...0&postcount=10 (in Italian).
                            -
                            ------

                            Comment


                            • Re: Seasonal Flu 2008 - 2009

                              HPA National Influenza Summary 2008/2009

                              The HPA National Influenza Reports for 2008/09 season will be published fortnightly until activity begins to increase, when they will be published weekly. A short summary of activity will be made available in the weeks between the fortnightly reports. The next complete influenza report will be published on Wednesday 26 November 2008.
                              Reporting period: Week 46 (10/11/08-16/11/08)

                              Influenza activity remained stable at low levels across all the countries of the United Kingdom during week 46/08. Some clinical indicators of influenza have slightly increased in England, Scotland and Wales but have slightly decreased in Northern Ireland in week 46/08, compared with week 45/08. Flu activity in countries with baseline activity thresholds are well below this level. Reports of influenza A and B from NHS and HPA laboratories are also at low levels, similar to week 45/08 and laboratory reports of RSV stayed at a similar level as week 45/08. Eighteen samples referred to the Centre for Infections' Respiratory Virus Unit (RVU) tested positive for influenza A (H3), which is an increase from seven in week 45/08 and three tested positive for RSV during week 46/08. There were no influenza A (H1) positive samples in week 46/08, compared to three in week 45/08. In Scotland three sentinel samples (15%) and one routine sample (3.1%) tested positive for influenza A.
                              Levels of influenza activity in Europe were low in week 45/08.
                              Neuraminidase inhibitor susceptibility testing on 18 out of 36 influenza A (H3) isolates since week 36/08 showed that all are sensitive to oseltamivir and zanamivir, but resistant to amantadine. Of the three influenza B isolates received since week 36/08, all are sensitive to oseltamivir and zanamivir. In the same time period, 13 influenza A (H1) isolates have been received and tested, of which twelve are resistant to oseltamivir but sensitive to zanamivir and amantadine. All of these 12 are from South West England and are being followed up in more detail.
                              Two outbreaks of respiratory illness have been reported from schools in week 47/08, one in East England and one in South England. Both outbreaks are still under investigation.
                              The weekly data on flu vaccination uptake in England continued to increase. The uptake rates for the over 65 years increased from 62.5% in week 45/08 to 66% in week 46/08. The uptake rates for the under 65 years at risk group increased from 35% in week 45/08 to 37.9% in week 46/08.


                              Last reviewed: 19 November 2008

                              Comment


                              • Re: Seasonal Flu 2008 - 2009

                                Influenza antiviral resistance during Northern Hemisphere season 2008-09 [ECDC]
                                Influenza antiviral resistance during Northern Hemisphere season 2008-09 [page under development]

                                Since the start of the surveillance season (week 40-2008) analyses of antiviral susceptibility by genetic or phenotypic methods have been reported for 15 influenza viruses, eleven A(H1N1) and three A(H3N2) from the UK and one A(H1N1) from Norway.

                                Eleven of the twelve A(H1N1) viruses were shown to be resistant to oseltamivir (10 from the UK and 1 from Norway) and one to be sensitive; all those tested against zanamivir (4) and amantadine (2) were shown to be sensitive.

                                The two A(H3N2) viruses tested against amantadine were shown to be resistant; all three A(H3N2) viruses were shown to be sensitive to oseltamivir and zanamivir.
                                -
                                <cite cite="http://ecdc.europa.eu/en/Health_Topics/influenza/antivirals.aspx">http://ecdc.europa.eu/en/Health_Topi...ntivirals.aspx</cite>

                                Comment

                                Working...
                                X