Announcement

Collapse
No announcement yet.

Seasonal Flu 2008 - 2009

Collapse
X
 
  • Filter
  • Time
  • Show
Clear All
new posts

  • Re: Seasonal Flu 2008 - 2009

    Originally posted by ironorehopper View Post
    Influenza antiviral resistance during Northern Hemisphere season 2008-09 [ECDC]
    Influenza antiviral resistance during Northern Hemisphere season 2008-09 [page under development]

    Since the start of the surveillance season (week 40-2008) analyses of antiviral susceptibility by genetic or phenotypic methods have been reported for 15 influenza viruses, eleven A(H1N1) and three A(H3N2) from the UK and one A(H1N1) from Norway.

    Eleven of the twelve A(H1N1) viruses were shown to be resistant to oseltamivir (10 from the UK and 1 from Norway) and one to be sensitive; all those tested against zanamivir (4) and amantadine (2) were shown to be sensitive.

    The two A(H3N2) viruses tested against amantadine were shown to be resistant; all three A(H3N2) viruses were shown to be sensitive to oseltamivir and zanamivir.
    -
    <CITE cite=http://ecdc.europa.eu/en/Health_Topics/influenza/antivirals.aspx>http://ecdc.europa.eu/en/Health_Topics/influenza/antivirals.aspx</CITE>
    Today's report from the UK


    indicates they have now tested 13 H1N1 isolates and 12 are resistant (all from southwestern England), so the updated totals for Europe are 13/14 were resistant to oseltamivir (and I believe the positive in Norway had been infected in the US).

    "13 influenza A (H1) isolates have been received and tested, of which twelve are resistant to oseltamivir but sensitive to zanamivir and amantadine. All of these 12 are from South West England and are being followed up in more detail."

    Comment


    • Re: Seasonal Flu 2008 - 2009

      Commentary


      Comment


      • Re: Seasonal Flu 2008 - 2009

        EISS - Weekly Electronic Bulletin Week 46 : 10/11/2008-16/11/2008 - 21 November 2008, Issue N? 280 Influenza activity in Europe continues to be low ? more countries report initial virus detections
        EISS - Weekly Electronic Bulletin Week 46 : 10/11/2008-16/11/2008 - 21 November 2008, Issue N? 280 Influenza activity in Europe continues to be low ? more countries report initial virus detections
        ? Summary:
        The level of influenza activity was low in all countries reporting data in week 46/2008. Since week 40/2008, sporadic laboratory-confirmed cases of influenza have been reported from 18 countries across Europe.

        ? Epidemiological situation - week 46/2008:
        For the intensity indicator, the national network levels of influenza-like illness (ILI) and/or acute respiratory infection (ARI) were low in all the 25 countries providing data. However, marked increases in the consultation rates for ILI and/or ARI within the 0-4 age group were reported by Austria, Belgium, Bulgaria, England and Spain. For the geographical spread indicator, sporadic influenza activity was reported in 12 countries (Czech Republic, Denmark, England, Hungary, Ireland, Netherlands, Northern Ireland, Norway, Portugal, Spain, Sweden and Switzerland) and no activity in the other 13 countries.

        ? Cumulative epidemiological situation ? 2008-2009 season (weeks 40-46/2008):
        So far this season, the consultation rates for ILI and/or ARI are at levels usually seen outside the winter period (i.e. below the national baseline threshold).Virological situation - week 46/2008: The total number of respiratory specimens collected by sentinel physicians in week 46/2008 was 451, of which 32 (7.1%) were positive for influenza virus: 29 type A (22 subtype H3 and seven not subtyped) and three type B. In addition, 30 influenza virus detections were reported from non-sentinel sources (e.g. specimens collected for diagnostic purposes in hospitals): 28 type A (six subtype H3 and 22 not subtyped) and two type B. Detection of influenza viruses was reported from 13 countries across Europe and included the first detections in Czech Republic, Hungary and Italy.

        ? Cumulative virological situation ? 2008-2009 season (weeks 40-46/2008):
        Of 192 virus detections (sentinel and non-sentinel) since week 40/2008, 171 were type A (73 subtype H3, 15 subtype H1 and 83 not subtyped) and 21 were type B. Based on the antigenic and/or genetic characterisation of 41 influenza viruses, three were reported as A/Brisbane/59/2007 (H1N1)-like, 35 as A/Brisbane/10/2007 (H3N2)-like, one as B/Florida/4/2006-like (B/Yamagata/16/88 lineage) and two as B/Malaysia/2506/2004-like (B/Victoria/2/87 lineage).

        Analyses of antiviral susceptibility by genetic or phenotypic methods have been reported for 26 influenza viruses, 11 A(H1N1) and 15 A(H3N2) from England and one A(H1N1) from Norway. Eleven of the 12 A(H1N1) viruses were shown to be resistant to oseltamivir (10 from England and 1 from Norway) and one to be sensitive; all those tested against zanamivir (12) and amantadine (4) were shown to be sensitive. The six A(H3N2) viruses tested against amantadine were shown to be resistant; all 15 A(H3N2) viruses were shown to be sensitive to oseltamivir and zanamivir.

        ? Comment:
        An increasing number of countries reported sporadic influenza virus detection compared to previous weeks (12 versus five or less in previous weeks), although this was not accompanied by significant increases in overall consultation rates. The 18 countries that have detected influenza viruses since week 40/2008 are geographically distributed throughout Europe. The majority (89%; 171/192) of virus detections up to week 46 have been type A, a percentage unchanged since week 45. The proportion of type A viruses subtyped as H3 has increased from 72% up to week 45 to 83% (73/88) at week 46. Although this represents an apparent increase in prevalence of the H3 subtype, it is too soon to conclude which virus type or subtype may become dominant in Europe this season.

        Similarly, limited data from only two countries (England and Norway) are available for antiviral resistance and although most (11/12) of the A(H1N1) viruses analysed to date are oseltamivir-resistant, these represent very early-season isolates. It is too early to comment on the antiviral-resistance pattern for Europe as a whole.

        Whilst influenza activity in Europe is currently low, reports of RSV (Respiratory Syncytial Virus which induces clinical symptoms similar to influenza) from countries in Europe that report RSV detections to EISS showed continued increases in the Netherlands and Northern Ireland). Increase in RSV detections at this time of the year is a normal phenomenon in these countries.

        ? Background:
        The Weekly Electronic Bulletin presents and comments on influenza activity in the 30 European countries that are members of EISS. In week 46/2008, 25 countries reported clinical data and 26 countries reported virological data to EISS. The spread of influenza virus strains and their epidemiological impact in Europe are being monitored by EISS under the aegis of the European Centre for Disease Prevention and Control in Stockholm (Sweden) in collaboration with the WHO Collaborating Centre in London (UK).

        ? Map
        The map presents the intensity of influenza activity and the geographical spread as assessed by each of the networks in EISS.

        <table style="width: auto;"><tbody><tr><td></td></tr><tr><td style="font-family: arial,sans-serif; font-size: 11px; text-align: right;">From MAPS</td></tr></tbody></table>
        <table style="width: auto;"><tbody><tr><td></td></tr><tr><td style="font-family: arial,sans-serif; font-size: 11px; text-align: right;">From MAPS</td></tr></tbody></table>

        Europe Year 2008 / Week 46

        A = Dominant virus A
        H1N1 = Dominant virus A(H1N1)
        H3N2 = Dominant virus A(H3N2)
        H1N2 = Dominant virus A(H1N2)
        B = Dominant virus B
        A & B = Dominant virus A & B

        = : stable clinical activity
        + : increasing clinical activity
        - : decreasing clinical activity

        Low = no influenza activity or influenza at baseline levels
        Medium = usual levels of influenza activity
        High = higher than usual levels of influenza activity
        Very high = particularly severe levels of influenza activity

        No activity = no evidence of influenza virus activity (clinical activity remains at baseline levels)
        Sporadic = isolated cases of laboratory confirmed influenza infection
        Local outbreak = increased influenza activity in local areas (e.g. a city) within a region,or outbreaks in two or more institutions (e.g. schools) within a region. Laboratory confirmed.
        Regional activity = influenza activity above baseline levels in one or more regions witha population comprising less than 50% of the country's total population. Laboratory confirmed.
        Widespread = influenza activity above baseline levels in one or more regions with a populationcomprising 50% or more of the country's population. Laboratory confirmed.
        Finland : Where available, the epidemiological data are provided by a health-care district inSouth-Western Finland (the health-care district serves 54,000 inhabitants i.e. approximately onepercent of the Finnish population).

        ? Network comments (where available)

        - Italy

        Two A/H3N2 influenza viruses have been isolated during this week. One further A/H3N2 virus had been previously isolated from a sample collected in week 43/08.

        - Netherlands
        In week 46, a specimen from a sentinel boy patient of 10 years old with ILI was positive for infleunza virus A(H3N2). The patient has not visited foreign countries recently.

        - Spain
        Sporadic B and AH3 isolates with a dispersed geographic distribution

        - Switzerland
        Positive specimen were detected for the second consecutive week. 3 Influenza A viruses were detected during the week 46. However, clinical declarations remained below the epidemic threshold.
        -
        <cite cite="http://www.eiss.org/cgi-files/bulletin_v2.cgi">EISS - Bulletin Review</cite>

        Comment


        • Re: Seasonal Flu 2008 - 2009

          <TABLE border=1><CAPTION>INFLUENZA VIRUSES ISOLATED BY
          WHO/NREVSS Collaborating Laboratories
          2008 - 2009 Season
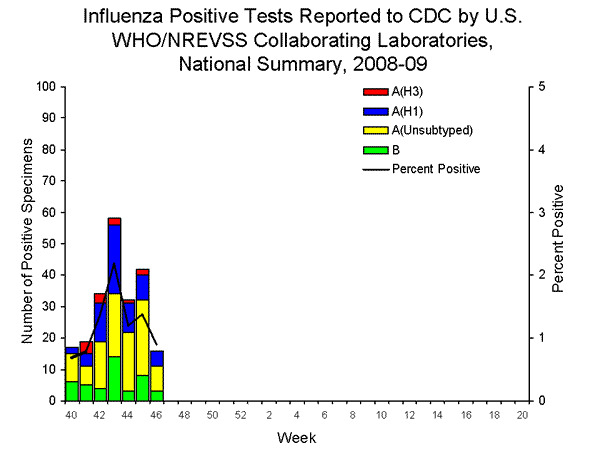
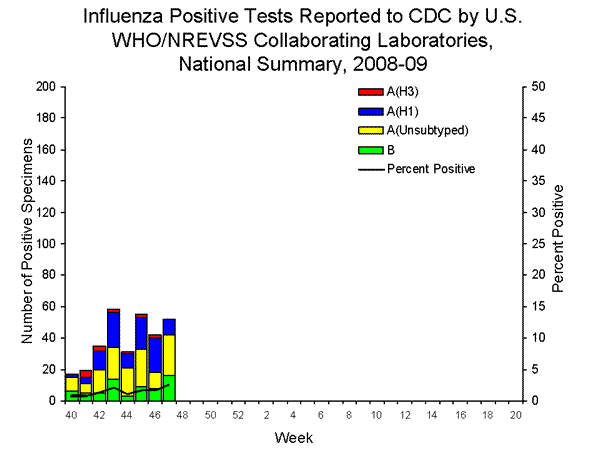
          </CAPTION><TBODY><TR><TH id=header1 width=70>Week</TH><TH id=header2 width=90>A(H1)</TH><TH id=header3 width=70>A(H3)</TH><TH id=header4 width=70>A(Unk)</TH><TH id=header5 width=70>B </TH><TH id=header6 align=right>Total # Tested</TH><TH id=header7 align=right>% Positive</TH></TR><TR><TD align=right headers=header1>40 </TD><TD align=right headers=header2>2 </TD><TD align=right headers=header3>0 </TD><TD align=right headers=header4>9 </TD><TD align=right headers=header5>6 </TD><TD align=right headers=header6>2449 </TD><TD align=right headers=header7>0.69 </TD></TR><TR><TD align=right headers=header1>41 </TD><TD align=right headers=header2>4 </TD><TD align=right headers=header3>4 </TD><TD align=right headers=header4>6 </TD><TD align=right headers=header5>5 </TD><TD align=right headers=header6>2447 </TD><TD align=right headers=header7>0.78 </TD></TR><TR><TD align=right headers=header1>42 </TD><TD align=right headers=header2>12 </TD><TD align=right headers=header3>3 </TD><TD align=right headers=header4>15 </TD><TD align=right headers=header5>4 </TD><TD align=right headers=header6>2505 </TD><TD align=right headers=header7>1.36 </TD></TR><TR><TD align=right headers=header1>43 </TD><TD align=right headers=header2>22 </TD><TD align=right headers=header3>2 </TD><TD align=right headers=header4>20 </TD><TD align=right headers=header5>14 </TD><TD align=right headers=header6>2653 </TD><TD align=right headers=header7>2.19 </TD></TR><TR><TD align=right headers=header1>44 </TD><TD align=right headers=header2>9 </TD><TD align=right headers=header3>1 </TD><TD align=right headers=header4>19 </TD><TD align=right headers=header5>3 </TD><TD align=right headers=header6>2666 </TD><TD align=right headers=header7>1.2 </TD></TR><TR><TD align=right headers=header1>45 </TD><TD align=right headers=header2>8 </TD><TD align=right headers=header3>2 </TD><TD align=right headers=header4>24 </TD><TD align=right headers=header5>8 </TD><TD align=right headers=header6>3040 </TD><TD align=right headers=header7>1.38 </TD></TR><TR><TD align=right headers=header1>46 </TD><TD align=right headers=header2>5 </TD><TD align=right headers=header3>0 </TD><TD align=right headers=header4>8 </TD><TD align=right headers=header5>3 </TD><TD align=right headers=header6>1772 </TD><TD align=right headers=header7>0.9 </TD></TR></TBODY></TABLE>

          Comment


          • Re: Seasonal Flu 2008 - 2009

            Commentary

            H1N1 Tamiflu Resistance in England Exceeds 92&#37;
            Recombinomics Commentary 18:05
            November 20, 2008

            13 influenza A (H1) isolates have been received and tested, of which twelve are resistant to oseltamivir but sensitive to zanamivir and amantadine. All of these 12 are from South West England and are being followed up in more detail.

            The above quote from today’s UK report indicate the three most recent H1N1 isolates are oseltamivir resistant, so the frequency of H274Y in H1N1 in the UK now exceeds 92%. These high levels are not a surprise. Last season the have majority of H1N1 isolates with H274Y were due to a Brisbane/59 dominant sub-clade. That sub-clade emerged in South Africa over the summer and the H274Y frequency was 100% (215/215). Other countries in the southern hemisphere had similar high frequencies, which was firmly tied to the acquisition of D354G, which was present in all public clade 2A and clade 2C sequences from the past few years.

            Thus, the all isolates in the dominant sub-clade had D354G in addition to H274Y which led to the dramatic spread of oseltamivir resistance last season in the northern hemisphere, which is likely to increase to levels close to 100% this year as evidenced by the detection of H274Y in 13/14 tested H1N1 isolates in Europe this season.


            .
            "The next major advancement in the health of American people will be determined by what the individual is willing to do for himself"-- John Knowles, Former President of the Rockefeller Foundation

            Comment


            • Re: Seasonal Flu 2008 - 2009

              2008-2009 Influenza Season Week 46, ending November 15, 2008
              (All data are preliminary and may change as more reports are received.)
              Synopsis:

              During week 46 (November 9-15, 2008), a low level of influenza activity was reported in the United States.
              • Sixteen (0.9%) specimens tested by U.S. World Health Organization (WHO) and National Respiratory and Enteric Virus Surveillance System (NREVSS) collaborating laboratories, and reported to CDC/Influenza Division, were positive for influenza.
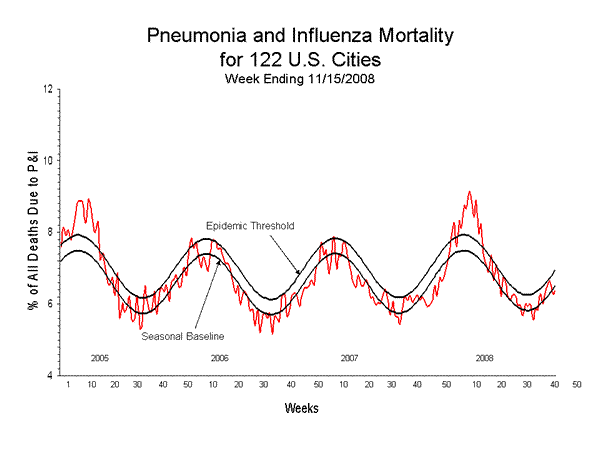
              • The proportion of deaths attributed to pneumonia and influenza (P&I) was below the epidemic threshold.
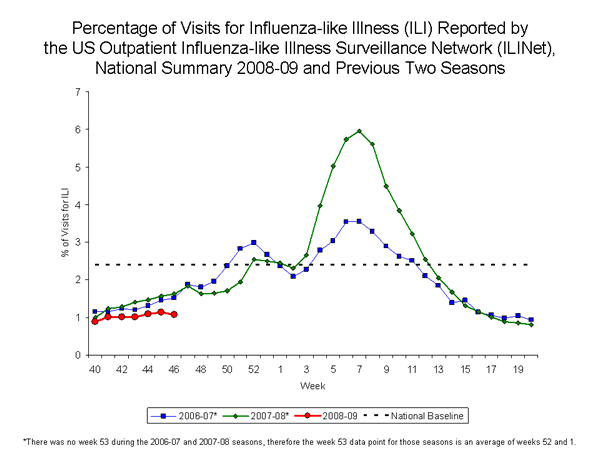
              • The proportion of outpatient visits for influenza-like illness (ILI) was below national and region-specific baseline levels.
              • Twenty-one states, the District of Columbia, and Puerto Rico reported sporadic influenza activity and 29 states reported no influenza activity.
              • One human infection with a novel influenza A virus was reported.
              <TABLE class=table cellSpacing=0 cellPadding=3 align=center border=0><CAPTION>National and Regional Summary of Select Surveillance Components

              </CAPTION><TBODY><TR vAlign=top><TH vAlign=bottom width=85 rowSpan=2>
              Region
              </TH><TH noWrap align=middle width=300 colSpan=3>Data for current week</STRONG></TH><TH noWrap align=middle width=276 colSpan=5>Data cumulative for the season</TH></TR><TR vAlign=top><TH align=middle width=72>Out-patient ILI*</TH><TH align=middle width=72>% positive for flu?</TH><TH align=middle width=96>Number of jurisdictions reporting regional or widespread activity?</TH><TH noWrap align=middle width=48>A (H1)</TH><TH noWrap align=middle width=48>A (H3)</TH><TH align=middle width=60>A Unsub-typed</TH><TH noWrap align=middle width=48>B</TH><TH align=middle width=72>Pediatric Deaths</TH></TR><TR><TD align=left width=85>Nation</TD><TD noWrap align=middle width=72>Normal</TD><TD noWrap align=middle width=72>0.9 % </TD><TD noWrap align=middle width=96>0 of 51 </TD><TD noWrap align=middle width=48>62</TD><TD noWrap align=middle width=48>12</TD><TD noWrap align=middle width=60>101</TD><TD noWrap align=middle width=48>43</TD><TD noWrap align=middle width=72>0</TD></TR><TR><TD align=left width=85>New England</TD><TD noWrap align=middle width=72>Normal</TD><TD noWrap align=middle width=72>0.3 % </TD><TD noWrap align=middle width=96>0 of 6</TD><TD noWrap align=middle width=48>0</TD><TD noWrap align=middle width=48>1</TD><TD noWrap align=middle width=60>0</TD><TD noWrap align=middle width=48>1</TD><TD noWrap align=middle width=72>0</TD></TR><TR><TD align=left width=85>Mid-Atlantic</TD><TD noWrap align=middle width=72>Normal</TD><TD noWrap align=middle width=72>0.2 % </TD><TD noWrap align=middle width=96>0 of 3</TD><TD noWrap align=middle width=48>2</TD><TD noWrap align=middle width=48>0</TD><TD noWrap align=middle width=60>2</TD><TD noWrap align=middle width=48>1</TD><TD noWrap align=middle width=72>0</TD></TR><TR><TD align=left width=85>East North Central</TD><TD noWrap align=middle width=72>Normal</TD><TD noWrap align=middle width=72>3.6 % </TD><TD noWrap align=middle width=96>0 of 5</TD><TD noWrap align=middle width=48>3</TD><TD noWrap align=middle width=48>0</TD><TD noWrap align=middle width=60>2</TD><TD noWrap align=middle width=48>4</TD><TD noWrap align=middle width=72>0</TD></TR><TR><TD align=left width=85>West North Central</TD><TD noWrap align=middle width=72>Normal</TD><TD noWrap align=middle width=72>0.3 % </TD><TD noWrap align=middle width=96>0 of 7</TD><TD noWrap align=middle width=48>0</TD><TD noWrap align=middle width=48>0</TD><TD noWrap align=middle width=60>2</TD><TD noWrap align=middle width=48>1</TD><TD noWrap align=middle width=72>0</TD></TR><TR><TD align=left width=85>South Atlantic</TD><TD noWrap align=middle width=72>Normal</TD><TD noWrap align=middle width=72>1.1 % </TD><TD noWrap align=middle width=96>0 of 9</TD><TD noWrap align=middle width=48>6</TD><TD noWrap align=middle width=48>2</TD><TD noWrap align=middle width=60>28</TD><TD noWrap align=middle width=48>13</TD><TD noWrap align=middle width=72>0</TD></TR><TR><TD align=left width=85>East South Central</TD><TD noWrap align=middle width=72>Normal</TD><TD noWrap align=middle width=72>0.0 % </TD><TD noWrap align=middle width=96>0 of 4</TD><TD noWrap align=middle width=48>0</TD><TD noWrap align=middle width=48>0</TD><TD noWrap align=middle width=60>0</TD><TD noWrap align=middle width=48>0</TD><TD noWrap align=middle width=72>0</TD></TR><TR><TD align=left width=85>West South Central</TD><TD noWrap align=middle width=72>Normal</TD><TD noWrap align=middle width=72>2.3 % </TD><TD noWrap align=middle width=96>0 of 4</TD><TD noWrap align=middle width=48>6</TD><TD noWrap align=middle width=48>0</TD><TD noWrap align=middle width=60>21</TD><TD noWrap align=middle width=48>12</TD><TD noWrap align=middle width=72>0</TD></TR><TR><TD align=left width=85>Mountain</TD><TD noWrap align=middle width=72>Normal</TD><TD noWrap align=middle width=72>0.6 % </TD><TD noWrap align=middle width=96>0 of 8</TD><TD noWrap align=middle width=48>0</TD><TD noWrap align=middle width=48>7</TD><TD noWrap align=middle width=60>5</TD><TD noWrap align=middle width=48>3</TD><TD noWrap align=middle width=72>0</TD></TR><TR><TD align=left width=85>Pacific</TD><TD noWrap align=middle width=72>Normal</TD><TD noWrap align=middle width=72>2.9 % </TD><TD noWrap align=middle width=96>0 of 5</TD><TD noWrap align=middle width=48>45</TD><TD noWrap align=middle width=48>2</TD><TD noWrap align=middle width=60>41</TD><TD noWrap align=middle width=48>8</TD><TD noWrap align=middle width=72>0</TD></TR></TBODY></TABLE>
              * Elevated means the % of visits for ILI is at or above the national or region-specific baseline
              ? National data is for current week; regional data is for the most recent three weeks.
              ? Includes all 50 states and the District of Columbia
              U.S. Virologic Surveillance:

              During week 46, WHO and NREVSS laboratories located in all 50 states and Washington D.C. reported 1,772 specimens tested for influenza viruses, 16 of which were positive: five influenza A (H1) viruses (Mid-Atlantic, South Atlantic, and West South Central regions), eight influenza A viruses that were not subtyped (East North Central, Mountain, Pacific, and West South Central regions), and three influenza B viruses (East North Central, South Atlantic, and West South Central regions). Twenty-three states from eight of the nine surveillance regions have reported laboratory-confirmed influenza this season.
              <CENTER>
              View WHO-NREVSS Regional Bar Charts| View Chart Data | View Full Screen </CENTER>Antigenic Characterization:

              CDC has antigenically characterized one influenza virus collected by U.S. laboratories since October 1, 2008. This influenza B virus was characterized as B/Florida/04/2006-like. The influenza B component of the 2008-09 influenza vaccine is a B/ Florida/04/2006-like virus.
              In addition, a small number of isolates from specimens collected during September have been antigenically characterized: one influenza A (H1N1), three influenza A (H3N2), and four influenza B viruses. All seven viruses were antigenically related to the components selected for the 2008-09 influenza vaccine (A/Brisbane/59/2007-like (H1N1), A/Brisbane/10/2007-like (H3N2) and B/Florida/04/2006-like).
              It is too early in the influenza season to determine which influenza viruses will predominate or how well the vaccine and circulating strains will match.
              Novel Influenza A Viruses:

              One case of human infection with a novel influenza A virus was reported by the Texas Department of State Health Services during week 46. The person was infected with a swine influenza A (H1N1) virus, and reported several swine exposures including close contact with an ill pig. Although human infection with swine influenza is uncommon, sporadic cases have occurred in many years, usually among people in direct contact with ill pigs or who have been in places where pigs may have been present (e.g. agricultural fairs, farms, or petting zoos). The sporadic cases of human infections with swine influenza viruses identified in recent years have not resulted in sustained human-to-human transmission or community outbreaks. Nonetheless, when cases are identified, CDC recommends thorough investigations to evaluate the extent of the outbreak and possible human to human transmission, as transmission patterns may change with changes in swine influenza viruses.
              Antiviral Resistance:

              In the United States, two groups of antiviral drugs have been approved by Food and Drug Administration for use in treating or preventing influenza virus infections. These two groups of antiviral drugs are the neuraminidase inhibitors (oseltamivir and zanamivir) and the adamantanes (amantadine and rimantadine). A description of these drugs can be found at: http://www.cdc.gov/flu/protect/antiviral/index.htm.
              • Neuraminidase Inhibitor Antiviral Drugs: Since October 1, 2008, two influenza A (H1N1) viruses, four influenza A (H3N2) viruses, and five influenza B viruses have been tested for antiviral resistance. One of the two influenza A (H1N1) viruses was found to be resistant to oseltamivir. All the influenza A (H3N2) viruses and influenza B viruses tested retain their sensitivity to oseltamivir. All tested viruses retain their sensitivity to zanamivir.
                In addition, CDC performed antiviral resistance testing on one influenza A (H1N1), three influenza A (H3N2), and four influenza B viruses collected during September. All tested viruses are sensitive to both oseltamivir and zanamivir.
                Additional information on antiviral resistance can be found at: http://www.cdc.gov/flu/about/qa/antiviralresistance.htm.
                Adamantane Antiviral Drugs: Three isolates from specimens collected during September were tested for adamantane resistance. The one influenza A (H1N1) virus tested and the two influenza A (H3N2) viruses tested were resistant to the adamantanes. The adamantanes are not effective against influenza B viruses.
                Based on the level of oseltamivir resistance observed in only one influenza subtype, H1N1, and the persisting high levels of resistance to the adamantanes in H3N2 viruses, CDC continues to recommend the use of oseltamivir and zanamivir for the treatment or prevention of influenza in the United States. Use of amantadine or rimantadine is not recommended. Guidance on influenza antiviral use can be found at: http://www.cdc.gov/mmwr/preview/mmwrhtml/rr57e717a1.htm
              Pneumonia and Influenza (P&I) Mortality Surveillance

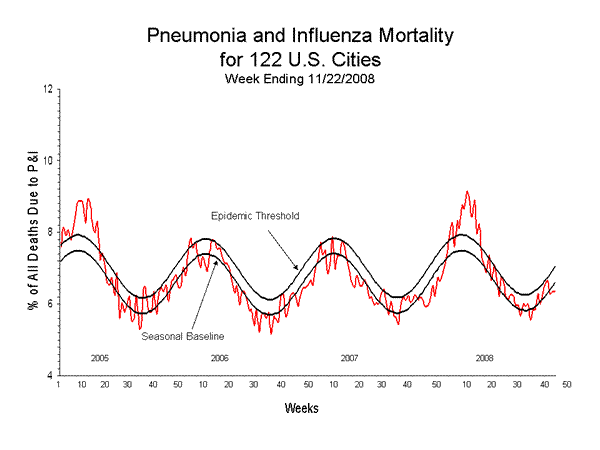
              During week 46, 6.4% of all deaths reported through the 122-Cities Mortality Reporting System were due to P&I. This percentage is below the epidemic threshold of 6.9% for week 46.
              <CENTER>
              View Full Screen</CENTER>Influenza-Associated Pediatric Mortality

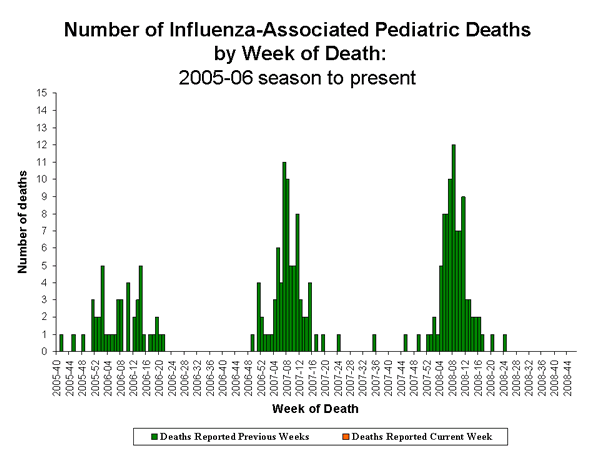
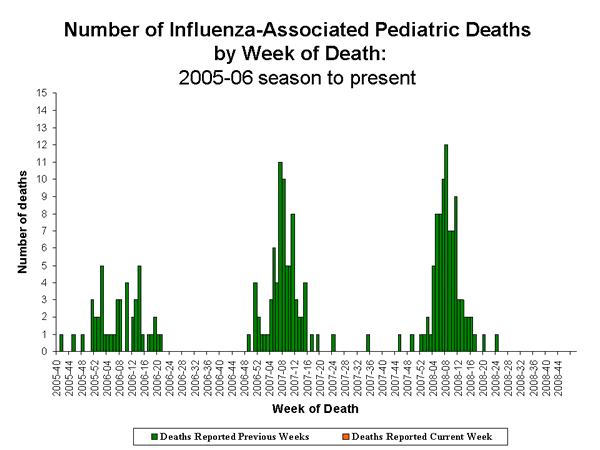
              No influenza-associated pediatric deaths were reported during week 46.
              <CENTER>
              View Full Screen</CENTER>Influenza-Associated Hospitalizations

              Laboratory-confirmed influenza-associated hospitalizations are monitored in two population-based surveillance networks: the Emerging Infections Program (EIP) and the New Vaccine Surveillance Network (NVSN). EIP and NVSN estimated rates of hospitalization for influenza will be reported every two weeks starting later this season.
              Outpatient Illness Surveillance:

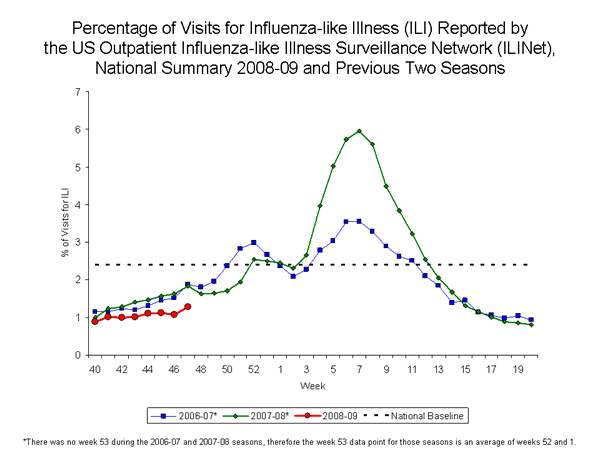
              During week 46, 1.1% of patient visits reported through the U.S. Outpatient Influenza-like Illness Surveillance Network (ILINet) (formerly known as the U.S. Influenza Sentinel Provider Surveillance Network) were due to influenza-like illness (ILI). This percentage is less than the national baseline of 2.4%. On a regional level, the percentage of visits for ILI ranged from 0.4% to 1.8%. All nine regions reported percentages of visits for ILI below their respective region-specific baselines.
              <CENTER>
              View Sentinel Providers Regional Charts | View Chart Data |View Full Screen
              </CENTER>Geographic Spread of Influenza as Assessed by State and Territorial Epidemiologists:


              During week 46 the following influenza activity was reported:
              • Sporadic activity was reported in the District of Columbia, Puerto Rico and 21 states (Alaska, California, Colorado, Connecticut, Florida, Hawaii, Idaho, Illinois, Indiana, Massachusetts, Maryland, Michigan, Nevada, New York, Pennsylvania, Rhode Island, Texas, Utah, Washington, Wisconsin, and Wyoming).
              • No influenza activity was reported in 29 states (Alabama, Arizona, Arkansas, Delaware, Georgia, Iowa, Kansas, Kentucky, Louisiana, Maine, Minnesota, Mississippi, Missouri, Montana, Nebraska, New Hampshire, New Jersey, New Mexico, North Carolina, North Dakota, Ohio, Oklahoma, Oregon, South Carolina, South Dakota, Tennessee, Vermont, Virginia, and West Virginia).

              <OBJECT id=Banner height=420 width="100%" classid=clsid27CDB6E-AE6D-11cf-96B8-444553540000>


              </OBJECT>
              <SCRIPT type=text/javascript> var stamp = new Date() var movieurl = "/flu/weekly/smallmap/SmallFluActivity_v2.swf?c=FluMap&n=" + stamp.getTime(); var so = new SWFObject(movieurl, "Banner", "100%", "420", "7"); so.write("flashALTcontent"); so.addParam("scale", "noorder"); so.addParam("allowScriptAccess","sameDomain"); so.addParam("wmode", "transparent"); so.addParam("quality", "best"); so.addParam("salign", "r"); so.addParam("type", "application/x-shockwave-flash"); </SCRIPT>
              --------------------------------------------------------------------------------
              A description of surveillance methods is available at: http://www.cdc.gov/flu/weekly/fluactivity.htm
              <SCRIPT type=text/javascript> <!-- function popupnr(mylink, windowname, refocus) { var mywin, href; if (typeof(mylink) == 'string') href=mylink; else href=mylink.href; mywin = window.open('', windowname, 'width=450,height=550,scrollbars=yes'); // if opened the window if ( mywin.closed || (! mywin.document.URL) || (mywin.document.URL.indexOf("about") == 0) ) mywin.location=href; else if (refocus) mywin.focus(); return false; } //--> </SCRIPT>

              Comment


              • Re: Seasonal Flu 2008 - 2009

                Commentary

                Comment


                • Re: Seasonal Flu 2008 - 2009

                  Commentary

                  Comment


                  • Re: Seasonal Flu 2008 - 2009

                    translation from Russian

                    Doctors, epidemiologists predict the winter season 2008-2009 year growth in the incidence of influenza and acute infectious diseases of the respiratory tract. The greatest risk of falling ill influenza - children. To prevent these diseases and to avoid complications recommended vaccinations.

                    According to the National Center for Preventive Medicine (NTSPM) for the January-September 2008 in the republic were registered 2 thousand cases of influenza incidence was about 53 cases per 100 thousand people. Influenza place in light and medium clinical forms. Severe cases were reported. At the same time, recorded more than 164 thousand cases of acute infectious diseases, the incidence rate was about 4 thousand cases per 100 thousand population.

                    "At the current stage of world medicine has no effective means to prevent and treat influenza. It is therefore necessary to hold a series of measures to prevent the disease and mitigate its severity," - told the agency deputy director NTSPM Bartholomew Kalmyk. Specialists in this field are encouraged to include in your diet foods rich in vitamins, standing zakalivanie organism vaccinated against influenza, and avoid bad habits such as smoking, excessive consumption of alcohol and drug use.

                    Clinically influenza seen a sudden headache, temperature, weakness, cough, pain in the chest and joints. The results of testing conducted NTSPM, suggests that aetiologically cases of influenza caused by mutation of seasonal influenza virus A (H3N2) with increased virulence compared with previous influenza virus subtype.

                    Врачи-эпидемиологи прогнозируют в зимний сезон 2008-2009 года рост заболеваемости гриппом и острыми инфекционными заболеваниями верхних дыхательных путей.

                    Comment


                    • Re: Seasonal Flu 2008 - 2009

                      translation from Russian

                      Moscow, Nov. 24. Specialists Rospotrebnadzora predict that the flu epidemic in Russia will begin no earlier than next year.

                      ?We expect an epidemic after the new year - January, February, March?, - said today at a press conference then head of epidemiological surveillance Rospotrebnadzora Elena Ezhlova transmit ?News?.

                      She noted that in recent years, peak flu epidemic in Russia has shifted in the spring and falls on February-March.

                      The rise of the incidence of ARI in the Russian regions began in early October, said Elena Ezhlova. But in the last two weeks have seen some slowdown due to holidays and school vacations, when children do not talk so often and closely with each other, as during the study.

                      A week later, Rospotrebnadzor predicts a new increase in cases since the holiday was over. In some cities, according to Ezhlovoy, for example, Barnaul and Norilsk, registered a slight excess of the threshold incidence of ARI among all population groups. But talking about the epidemic at present it is too early, she said.

                      Doctors said that, at the end of November - early December have to rush vaccine campaign. In their view, when a mass vaccination only 2% of the population suffer from side effects. But if you do not give time, people may face serious complications, particularly pneumonia, treatment, which is 21 days.
                      МОСКВА, 24 ноября. Специалисты Роспотребнадзора прогнозируют, что эпидемия гриппа начнется в России не раньше нового года. &quot;Мы ожидаем эпидемию после новог...

                      Comment


                      • Re: Seasonal Flu 2008 - 2009

                        Commentary

                        Comment


                        • Re: Seasonal Flu 2008 - 2009

                          Translation from Russian

                          November 25,'08 at 21:56

                          In the Donetsk region today received a flu shot for more than 12 thousand people.

                          This was reported in the Donetsk regional sanitary-epidemiological station. According to doctors, given neepidemichesky the incidence of respiratory infection in October and November, now - the optimum time for immunization.
                          Protivogrippoznye measures in the field this fall are taken from September 30.

                          According to epidemiologists, weekly from September 15-17 in the recorded thousands of sick respiratory infections, which is 30-50% below the epidemic threshold. Over the last week of November (from 13 to 20 November) has already exceeded the epidemic threshold of 30% in the age group of 7 to 14 years.

                          During this period, with severe respiratory infections and complications hospitalized more than 300 residents of the area, 263 of them - children under 14 years old.

                          In the regional SES reminded that the projected Ukrainian Center of influenza in the autumn-winter period 2008-2009 influenza epidemic is expected to moderate-intensity caused by the turning of a new Ukraine strain of influenza A virus (H3N2) Brisbane (Uruguay). In future epidemics, according to experts, will participate and influenza A viruses (H1N1) influenza virus in Brisbane, Florida. These strains were recommended by the World Health Organization to vaccine manufacturers of drugs for influenza vaccine manufacturing at predepidemichesky season 2008-2009.

                          Currently, Ukraine registered and authorized for use 4 vaccines that contain a specified strains (Vaksigrip, Influvak, Infleksal, Flyuariks)

                          Comment


                          • Re: Seasonal Flu 2008 - 2009

                            HPA Weekly National Influenza Report
                            Summary of UK* surveillance of influenza and other seasonal respiratory illness
                            26 November 2008 (Week 48
                            )

                            Summary
                            Clinical indices of acute respiratory illness
                            (England, Wales, Scotland and Northern Ireland)

                            The overall influenza-like illness incidence rate**
                            remained below the baseline activity threshold (30 per
                            100, 000) at 10.4 per 100,000 in week 46/08 which then
                            increased to 12.6 per 100,000 in week 47/08 (Figure 1).
                            The rate in the northern region decreased from 9.2 per
                            100,000 in week 46/08 to 7.2 per 100,000 in week 47/08,
                            *Incorporating data from the Royal College of General Practitioners (RCGP) (England and Wales), The National
                            Public Health Service for Wales (NPHS), Health Protection Scotland (HPS), Communicable Disease Surveillance
                            Centre Northern Ireland (CDSC Northern Ireland), the Office for National Statistics (ONS) (England and Wales),
                            Medical Officers of Schools Association (MOSA) (England) and NHS Direct (England and Wales).
                            Figure 1
                            : RCGP consultation rate for influenza ? like illness, 2007/08 and recent years, England and Wales

                            During weeks 46/08 and 47/08, influenza activity across the UK remained at low levels. Activity is still at baseline levels
                            in England, Scotland and Wales; thresholds have not yet been set for Northern Ireland. Some clinical indicators of
                            influenza have increased in England and Northern Ireland but have decreased slightly in Scotland and Wales. Of the
                            samples referred to the Centre for Infections? Respiratory Virus Unit (RVU) during weeks 46/08 and 47/08, 45 were
                            positive for influenza A, three A (H1) and 42 A (H3) and one for influenza B. Other NHS and HPA laboratories in England
                            and Wales reported 27 influenza A and three influenza B positive specimens during these two weeks. Three influenza
                            A positive specimens were reported from Scotland in week 46/08 and three influenza A (H3) from Northern Ireland in
                            week 47/08. One outbreak of respiratory illness was reported from a school in Wales in week 47/08; one sample
                            tested positive for influenza A. The weekly vaccine uptake rates for the over 65 years increased from 62.5% in week 45/
                            08 to 66% in week 46/08 and in the under 65 years at risk group it increased from 35% to 37.9% in the same time
                            period. Vaccine uptake data is not currently available for week 47/08. Influenza activity was at low levels throughout
                            the rest of Europe.
                            England and Wales
                            Royal College of General Practitioners
                            (
                            http://www.rcgp.org.uk/bru/index.asp)

                            Covered in this report:
                            Data, except that from ONS, MOSA and non-UK sources: 10/11/08 - 23/11/08 (Weeks 46 and 47, 2008 )
                            Data from ONS, MOSA and non-UK sources: 03/11/08 - 16/11/08 (Weeks 45 and 46, 2008)
                            ** RCGP incidence rates in this report only refer to first or new episodes of infection diagnosed by a GP.
                            Neuraminidase inhibitor susceptibility testing on 30 A (H3) isolates since week 36/08 showed that all are sensitive to
                            oseltamivir and zanamivir but resistant to amantadine. All of the four influenza B isolates received since week 36/08
                            are sensitive to oseltamivir and zanamivir
                            . Fourteen of fifteen A (H1) specimens tested in the same time frame are
                            resistant to oseltamivir but sensitive to zanamivir and amantadine. The majority of these resistant viruses come from
                            the south west of England with the remaining from Wales and northern England. Two influenza A (H1) isolates have
                            been found to be resistant to oseltamivir in Scotland this season.

                            Antiviral drug susceptibility test
                            an increase from 9 per 100,000 to 15.7 per 100,000 was
                            seen in the central region and the rate remained constant
                            in the south at 12.1 per 100,000 and 12.5 per 100,00 in
                            weeks 46 and 47/08 respectively. The rate was highest in
                            the 15-44 year age group at 17.1 per 100,000 in week 47/
                            08 (Figure 2).
                            The rate for acute bronchitis has been increasing steadily
                            over the season, it increased from 110.3 per 100,000 in
                            week 46/08 to 119.4 per 100,000 in week 47/08. The
                            episode incidence rate was highest in the 0-1 year age
                            group at 694.8 per 100 000 in week 47/08.
                            2
                            0
                            2 5
                            5 0
                            7 5
                            1 0 0
                            1 2 5
                            1 5 0
                            4 0 4 2 4 4 4 6 4 8 5 0 5 2 2 4 6 8 1 0 1 2 1 4 1 6 1 8 2 0
                            W e e k
                            Rate per 100 000 population
                            E n g l a n d ( R C G P )
                            S c o t l a n d ( H P S )
                            W a l e s ( N P H S )
                            N o r t h e r n I r e l a n d ( C D S C N I )
                            Figure 3
                            : GP Consultation rates for influenza/influenza-like illness in the U.K

                            QSurveillance
                            HPA and Nottingham University Division of Primary
                            Care.
                            (
                            http://www.qresearch.org)

                            Northern Ireland
                            CDSC Northern Ireland
                            (
                            http://www.cdscni.org.uk/)

                            The combined rate for influenza and influenza-like illness
                            nearly doubled from 26.5 per 100,000 (updated rate) in
                            week 46/08 to 44.7 per 100,000 in week 47/08 (Figure 3).
                            No threshold has been set for Northern Ireland.
                            This primary care surveillance system uses
                            QSurveillance, a database of general practice derived
                            data. During weeks 46/08 and 47/08, approximately
                            3200 practices reported from England, Wales, Scotland
                            and Northern Ireland covering a population of around 21
                            million. The rate of influenza-like illness increased from
                            9.8 per 100,000 in week 46/08 to 10.3 per 100,000 in
                            week 47/08. The highest rates have consistently been in
                            the 15-44 year age group. In weeks 46 and 47/08 the
                            rates were highest in London, Northern Ireland and the
                            West Midlands.
                            NHS Direct total call activity
                            England and Wales
                            (
                            http://www.nhsdirect.nhs.uk/)

                            Cold/flu and fever calls were low and within the baseline
                            levels during weeks 46/08 and 47/08. The proportion of
                            cold/flu calls remained the same at 0.6% in weeks 46
                            and 47/08 (the theshold is set at 1.2%). Fever calls in the
                            5-14 age group made up 6.3% of the total calls in week
                            47/08 which was similar to 6.4% in week 44/08, both are
                            lower than the threshold of 9%.
                            Wales
                            National Public Health Service
                            (
                            http://www.wales.nhs.uk/sites/home.cfm?OrgID=368)

                            GP consultation rates for influenza decreased from 4.2
                            per 100 000 in week 46/08 to 2.9 per 100,000 in week
                            47/08. Both figures are well below the baseline threshold
                            of 25 consultations per 100,000 (Figure 3).
                            Figure 2
                            : RCGP Episode incidence rates for influenza-like illness (ILI) by age group, England and Wales.

                            0
                            1 0
                            2 0
                            3 0
                            4 0
                            5 0
                            6 0
                            7 0
                            8 0
                            9 0
                            1 0 0
                            4 0 4 2 4 4 4 6 4 8 5 0 5 2 2 4 6 8 1 0 1 2 1 4 1 6 1 8 2 0
                            W e e k
                            Rate per 100 000 population
                            0 - 1
                            1 - 4
                            5 - 1 4
                            1 5 - 4 4
                            4 5 - 6 4
                            6 5 - 7 4
                            > 7 5
                            Medical Officers of Schools Association
                            (MOSA)
                            During weeks 45 and 46/08, 21 schools reported data.
                            There were no new episodes of influenza like illness
                            reported in week 45/08 and ten episodes in week 46/08
                            giving a rate of 4.8 per 1000. The rate of upper respiratory
                            tract infection in week 45/08 was 4.9 per 1000 population
                            (32 new episodes) which increased to 7.0 (42 new
                            episodes) in week 46/08.
                            Scotland
                            Health Protection Scotland
                            (
                            http://www.hps.scot.nhs.uk/)

                            GP consultation rates for influenza decreased from 13.0
                            per 100,000 in week 46/08 to 11.0 per 100,000 in week
                            47/08. Activity remains below the Scottish baseline
                            threshold of 50 consultations per 100,000 (Figure 3).
                            3
                            Respiratory Virus Unit (RVU) Influenza Reference
                            Laboratory, CfI
                            Forty-five specimens tested positive for influenza A viruses
                            in weeks 46/08 and 47/08 (Table 1). Since week 40/08 57
                            viruses have been characterised: nine A/Solomon Island/
                            3/2006 (H1)-like which is similar to the vaccine strain, two
                            A (H1) Brisbane/59/2007 (H1N1)-like (vaccine strain) and
                            46 A (H3) A/Brisbane/10/2007 (H3N2)-like (vaccine strain)
                            (Figure 4).
                            The majority of influenza A (H1) specimens
                            received to date come from Southern England (table
                            1).
                            Neuraminidase inhibitor susceptibility testing on 30 A
                            (H3) isolates since week 36/08 showed that all of them
                            are sensitive
                            to oseltamivir and zanamivir but resistant to
                            amantadine. Of the 15 A (H1) specimens received and
                            tested, 14 are resistant to oseltamivir but sensitive to
                            zanamivir and amantadine. These specimens are from
                            Northern and Southern England and Wales (table 1). Four

                            * RSV detection is by PCR only
                            Other NHS and HPA laboratories (England and
                            Wales)
                            The number of specimens positive for influenza A has
                            decreased slightly from 16 in week 46/08 to 11 in week
                            47/08 and the number of RSV positives increased
                            slightly (from 320 to 351) in the same time period. To
                            date, a similar number of influenza A and B positive
                            specimens have come from each area of England with
                            fewer from Wales. (Table 2).
                            Please note that these data are provisional.
                            Laboratory indices of acute respiratory illness
                            *
                            Detections of RSV by isolation are not included.

                            Table 1 ?Detections? (PCR and isolation) of influenza and
                            RSV made by RVU (CfI) Reference Laboratory.
                            Samples from community and hospital sources,
                            by week of report.
                            1 18 0 1
                            0 28 0 2
                            17 34 1 10
                            1 2 0 0
                            0 0 0 0
                            0 0 0 0
                            19 82 1 13
                            Influenza Detections by
                            PCR and Isolation
                            A (H1) A (H3) B RSV*
                            Cumulative to date
                            Northern England
                            Central England
                            Southern England
                            Wales
                            Scotland
                            Northern Ireland
                            Cumulative Total
                            Influenza type ( subtype)
                            Week 46/08
                            Week 47/08
                            (week 40/08 ? 47/08)
                            356 336 3922
                            Table 2 ??Detections? (isolation, PCR, direct
                            immunofluorescence and paired sera tests) of
                            influenza and RSV reported to CfI by NHS and
                            HPA microbiology laboratories. Data for England
                            and Wales by RCGP region, by week of report
                            Week 46/08
                            Week 47/08
                            Cumulative to Date
                            (week 40/08 - 47/08)
                            Northern England
                            Central England
                            Southern England
                            Wales
                            Cumulative Total
                            Detection (isolates, DIF and PCR)
                            Influenza A Influenza B RSV*
                            16 0 320
                            11 3 351
                            18 2 540
                            17 2 174
                            19 2 279
                            6 0 77
                            60 6 1070
                            1 23 0 3
                            2 19 1 0
                            Figure 4 : Total ( Community and Hospital) Influenza detections (PCR and Isolation) characterised by RVU,CfI, by week of
                            specimen
                            0
                            5
                            1 0
                            1 5
                            2 0
                            2 5
                            3 0
                            3 5
                            4 0
                            4 0 4 2 4 4 4 6 4 8 5 0 5 2 2 4 6 8 1 0 1 2 1 4 1 6 1 8 2 0
                            W e e k
                            Number of detections
                            I n f l u e n z a A ( H 1 )
                            I n f l u e n z a A ( H 3 )
                            I n f l u e n z a B
                            further influenza A(H1) isolates are undergoing
                            resistance testing at the moment. Four influenza B
                            isolates have been received and tested and all are
                            sensitive to oseltamivir and zanamivir.
                            Please note that these data are provisional.
                            4
                            Avian Influenza
                            The WHO continues to monitor and report on new cases
                            of human infection with A(H5N1) avian influenza when
                            they occur.
                            There have been no new human cases since the last
                            cases reported from Indonesia on 10 September 2008.
                            According to WHO, the total number of confirmed human
                            infections worldwide with H5N1, since December 2003,
                            is 387 of which 245 (63%) have died.
                            Useful link:
                            Situation updates from WHO (human):
                            Situation summary from the HPA (avian and human):
                            Virological data from Northern Ireland
                            (
                            http://www.cdscni.org.uk/)

                            The first three influenza A (H3) samples were reported
                            in week 47/08, two sentinel and one non-sentinel. In
                            week 46/08 21 non-sentinel samples were positive
                            for RSV and in week 47/08 this number was 29.
                            Flu Vaccination Campaign 2008/09 (England)
                            Data on influenza vaccination uptake is taken weekly from
                            a sample of GPs in England. Steady increasing trends
                            have been since since the start of the campaign in
                            September 2008.
                            The proportion vaccinated in the over 65 year age group
                            increased from 62.5% in week 45/08 to 66% in week 46/
                            08. In the under 65 years at risk group, the proportion
                            vaccinated increased from 35% in week 45/08 to 37.9%
                            in week 46/08. No data is currently available for week 47/
                            08.
                            It should be noted that all data is provisional.
                            This parallel GP sentinel scheme reported four out of
                            28 (14.3%) influenza A positive and one (3.6%)
                            influenza B positive specimens during weeks 46/08
                            and 47/08. To date, eight of the 14 oseltamavirresistant
                            A (H1) specimens have come from this
                            scheme. Two specimens were positive for RSV and
                            two for other respiratory viruses in the same time
                            period.
                            HPA CfI Virological Surveillance of Influenza
                            (England)
                            Outbreak Reports:
                            One outbreak was reported in week 47/08 from a school
                            in Wales. One specimen tested positive for influenza A.
                            CfI would welcome any reports of influenza outbreak
                            investigations. Please email any reports to
                            respdcsc@hpa.org.uk
                            ).

                            Mortality Data
                            Office for National Statistics
                            (
                            http://www.statistics.gov.uk)

                            The number of deaths registered in England and Wales
                            decreased from 9900 in week 45/08 to 9869 in week 46/
                            08. The number of deaths due to all respiratory diseases
                            (as underlying cause) stayed constant at 1215 (12.3%)
                            in week 45/08 and 1207 (12.2%) in week 46/08. The
                            weekly all cause registered deaths are shown in Figure
                            5. No excess deaths were detected in either week.
                            Other Reports (UK)
                            Virological data from Scotland
                            (
                            http://www.show.scot.nhs.uk/scieh/)

                            During week 46/08, out of 20 sentinel samples, which
                            were received through SERVIS, three were positive for
                            influenza A and one for RSV. Thirty-two routine samples
                            reported from hospital and community sources were
                            tested in week 46/08, one was positive for influenza A
                            and 31 positive for RSV. In week 47/08 22 sentinel
                            samples were received, three were positive for
                            influenza A and three for RSV. Fifty-seven non-sentinel
                            samples were also tested of which five for positive for
                            influenza A and 52 for RSV.
                            Two influenza A (H1) isolates from Scotland this
                            season have been found to be resistant to oseltamivir.
                            Figure 5 : Weekly all cause registered deaths in England and Wales
                            0
                            2 0 0 0
                            4 0 0 0
                            6 0 0 0
                            8 0 0 0
                            1 0 0 0 0
                            1 2 0 0 0
                            1 4 0 0 0
                            1 6 0 0 0
                            4 0 4 2 4 4 4 6 4 8 5 0 5 2 2 4 6 8 1 0 1 2 1 4 1 6 1 8 2 0
                            W e e k N u m b e r
                            Number of Deaths
                            O b s e r v e d
                            E x p e c t e d
                            9 5 % U p p e r L i m i t
                            Data Source: The National Influenza Vaccine Uptake
                            Monitoring Programme (HPA/DH)
                            5
                            Data for this report were collated by the Influenza/
                            Respiratory Virus Team:
                            Estelle McLean, Joy Field, Hongxin Zhao and Richard
                            Pebody
                            Respiratory and Systemic Infections Department
                            HPA Centre for Infections, 61 Colindale Avenue
                            London NW9 5EQ, United Kingdom
                            Tel: (0)20 8327 7768; Fax: (0)20 8200 7868
                            E-mail:
                            respcdsc@hpa.org.uk

                            Maria Zambon, Joanna Ellis, Angie Lackenby, Alison
                            Bermingham and Praveen Sebastianpillai
                            Respiratory Virus Unit, Virus Reference Department
                            HPA Centre for Infections, 61 Colindale Avenue
                            London NW9 5HT, United Kingdom
                            Tel: (0)20 8327 6239; Fax: (0)20 8205 8195
                            E-mail:
                            ernvl@hpa.org.uk

                            If you wish to be included on our email notification list
                            please send your address to:
                            respcdsc@hpa.org.uk

                            Acknowledgements
                            Canada
                            Public Health Agency of Canada
                            (
                            http://www.phac-aspc.gc.ca/fluwatch/index.html)

                            During weeks 45 and 46/08, influenza activity remained
                            low with the majority of the influenza surveillance regions
                            reporting no activity and eight regions reporting sporadic
                            influenza activity in week 46/08. A slight increase in the
                            consultation rates and number of viruses detected has
                            been reported. Seven of 1512 (1.5%) specimens tested
                            positive for influenza in week 45/08 and 10/1479 (0.7%)
                            in week 46/08.
                            Since 1 September 2008, five influenza viruses have
                            been characterised: one influenza A/Brisbane/59/
                            2007(H1N1)-like, one A/Brisbane/10/2007 (H3N2)-like,
                            two influenza B/Florida/4/2006-like and one B/Malaysia/
                            2506/2004-like. The influenza A (H1N1) isolate has been
                            found to be resistant to oseltamivir.
                            Ireland
                            Health Protection Surveillance Centre (HPSC)
                            (
                            http://www.hpsc.ie/)

                            Influenza activity in Ireland during weeks 46 and 47/
                            08 were at low levels. In week 46/08 the ILI consultation
                            rate was 9.3 per 100,000 and increased to
                            10.8 per 100,000 in week 47/08 (21 consultations).
                            In week 46/08 two of six sentinel specimens tested
                            positive for influenza A (H3) and 20 of 82 nonsentinel
                            specimens tested were positive for RSV. In
                            week 47/08 one of eight sentinel samples was
                            positive for influenza B, which is the first of the
                            season in Ireland. Thirty-one of 81 non-sentinel
                            samples were positive for RSV in week 47/08.
                            Other country reports can be obtained from the World
                            Health Organisation:
                            Europe
                            European Influenza Surveillance System (EISS)
                            (
                            www.eiss.org)

                            In weeks 45 and 46/08, low levels of seasonal influenza
                            activity were seen across all 26 European countries
                            participating in the EISS. In week 46/08 sporadic activity
                            was reported in England, Ireland, Northern Ireland,
                            Norway, Portugal, Romania, Spain, Sweden, Switzerland
                            and Wales and no activity in the remaining 13 countries.
                            Out of the total 451 respiratory specimens collected by
                            sentinel physicians during week 46/08, 32 (7.1%)
                            specimens tested positive for influenza, seven type A (not
                            subtyped), 22 A(H3) and three type B. In addition, 30 nonsentinel
                            specimens tested positive including six A (H3),
                            22 influenza A (not subtyped) and one type B. These
                            positive specimens were reported from 13 countries with
                            the Czech Republic, Hungary and Italy reporting
                            detections for the first time in the 2008/09 season.
                            Since week 40/08, 41 viruses have been characterised;
                            39 of these seem to be a good match to the strains
                            recommended for the 2008-09 vaccine, the remaining
                            two were B/Malaysia/2506/2004-like.
                            Influenza activity outside the UK
                            In week 46/08 WHO and NREVSS laboratories reported
                            1772 specimens tested for influenza viruses, 16 (0.9%)
                            of which were positive: five influenza A (H1) and eight
                            influenza A (not subtyped). One human case of swine
                            influenza A (H1N1) was reported in week 46/08, the person
                            had been exposed to an ill pig.
                            Since week 40/08 one influenza virus has been
                            characterised as B/Florida/04/2006-like, which is
                            antigenically similar to one of the components
                            recommended for the 2008-09 vaccine. Of the two
                            influenza A (H1) viruses tested this season, one has been
                            found to be resistant to oseltamiv


                            Comment


                            • Re: Seasonal Flu 2008 - 2009

                              2008-2009 Influenza Season Week 47, ending November 22, 2008
                              (All data are preliminary and may change as more reports are received.)
                              Synopsis:

                              During week 47 (November 16-22, 2008), a low level of influenza activity was reported in the United States.
                              • Fifty-two (2.5%) specimens tested by U.S. World Health Organization (WHO) and National Respiratory and Enteric Virus Surveillance System (NREVSS) collaborating laboratories and reported to CDC/Influenza Division were positive for influenza.
                              • The proportion of deaths attributed to pneumonia and influenza (P&I) was below the epidemic threshold.
                              • The proportion of outpatient visits for influenza-like illness (ILI) was below national and region-specific baseline levels.
                              • One state reported local influenza activity; the District of Columbia and 19 states reported sporadic influenza activity; 29 states reported no influenza activity; and one state did not report.
                              <TABLE class=table cellSpacing=0 cellPadding=3 align=center border=0><CAPTION>National and Regional Summary of Select Surveillance Components

                              </CAPTION><TBODY><TR vAlign=top><TH vAlign=bottom width=85 rowSpan=2>
                              Region
                              </TH><TH noWrap align=middle width=300 colSpan=3>Data for current week</STRONG></TH><TH noWrap align=middle width=276 colSpan=5>Data cumulative for the season</TH></TR><TR vAlign=top><TH align=middle width=72>Out-patient ILI*</TH><TH align=middle width=72>% positive for flu?</TH><TH align=middle width=96>Number of jurisdictions reporting regional or widespread activity?</TH><TH noWrap align=middle width=48>A (H1)</TH><TH noWrap align=middle width=48>A (H3)</TH><TH align=middle width=60>A Unsub-typed</TH><TH noWrap align=middle width=48>B</TH><TH align=middle width=72>Pediatric Deaths</TH></TR><TR><TD align=left width=85>Nation</TD><TD noWrap align=middle width=72>Normal</TD><TD noWrap align=middle width=72>2.5 % </TD><TD noWrap align=middle width=96>0 of 51 </TD><TD noWrap align=middle width=48>101</TD><TD noWrap align=middle width=48>14</TD><TD noWrap align=middle width=60>128</TD><TD noWrap align=middle width=48>66</TD><TD noWrap align=middle width=72>0</TD></TR><TR><TD align=left width=85>New England</TD><TD noWrap align=middle width=72>Normal</TD><TD noWrap align=middle width=72>0.5 % </TD><TD noWrap align=middle width=96>0 of 6</TD><TD noWrap align=middle width=48>0</TD><TD noWrap align=middle width=48>1</TD><TD noWrap align=middle width=60>2</TD><TD noWrap align=middle width=48>1</TD><TD noWrap align=middle width=72>0</TD></TR><TR><TD align=left width=85>Mid-Atlantic</TD><TD noWrap align=middle width=72>Normal</TD><TD noWrap align=middle width=72>0.1 % </TD><TD noWrap align=middle width=96>0 of 3</TD><TD noWrap align=middle width=48>2</TD><TD noWrap align=middle width=48>0</TD><TD noWrap align=middle width=60>2</TD><TD noWrap align=middle width=48>1</TD><TD noWrap align=middle width=72>0</TD></TR><TR><TD align=left width=85>East North Central</TD><TD noWrap align=middle width=72>Normal</TD><TD noWrap align=middle width=72>5.3 % </TD><TD noWrap align=middle width=96>0 of 5</TD><TD noWrap align=middle width=48>4</TD><TD noWrap align=middle width=48>0</TD><TD noWrap align=middle width=60>3</TD><TD noWrap align=middle width=48>6</TD><TD noWrap align=middle width=72>0</TD></TR><TR><TD align=left width=85>West North Central</TD><TD noWrap align=middle width=72>Normal</TD><TD noWrap align=middle width=72>0.3 % </TD><TD noWrap align=middle width=96>0 of 7</TD><TD noWrap align=middle width=48>0</TD><TD noWrap align=middle width=48>0</TD><TD noWrap align=middle width=60>2</TD><TD noWrap align=middle width=48>1</TD><TD noWrap align=middle width=72>0</TD></TR><TR><TD align=left width=85>South Atlantic</TD><TD noWrap align=middle width=72>Normal</TD><TD noWrap align=middle width=72>1.8 % </TD><TD noWrap align=middle width=96>0 of 9</TD><TD noWrap align=middle width=48>8</TD><TD noWrap align=middle width=48>2</TD><TD noWrap align=middle width=60>45</TD><TD noWrap align=middle width=48>23</TD><TD noWrap align=middle width=72>0</TD></TR><TR><TD align=left width=85>East South Central</TD><TD noWrap align=middle width=72>Normal</TD><TD noWrap align=middle width=72>0.0 % </TD><TD noWrap align=middle width=96>0 of 4</TD><TD noWrap align=middle width=48>0</TD><TD noWrap align=middle width=48>0</TD><TD noWrap align=middle width=60>0</TD><TD noWrap align=middle width=48>0</TD><TD noWrap align=middle width=72>0</TD></TR><TR><TD align=left width=85>West South Central</TD><TD noWrap align=middle width=72>Normal</TD><TD noWrap align=middle width=72>3.6 % </TD><TD noWrap align=middle width=96>0 of 4</TD><TD noWrap align=middle width=48>10</TD><TD noWrap align=middle width=48>0</TD><TD noWrap align=middle width=60>28</TD><TD noWrap align=middle width=48>20</TD><TD noWrap align=middle width=72>0</TD></TR><TR><TD align=left width=85>Mountain</TD><TD noWrap align=middle width=72>Normal</TD><TD noWrap align=middle width=72>1.2 % </TD><TD noWrap align=middle width=96>0 of 8</TD><TD noWrap align=middle width=48>2</TD><TD noWrap align=middle width=48>7</TD><TD noWrap align=middle width=60>7</TD><TD noWrap align=middle width=48>4</TD><TD noWrap align=middle width=72>0</TD></TR><TR><TD align=left width=85>Pacific</TD><TD noWrap align=middle width=72>Normal</TD><TD noWrap align=middle width=72>5.4 % </TD><TD noWrap align=middle width=96>0 of 5</TD><TD noWrap align=middle width=48>75</TD><TD noWrap align=middle width=48>4</TD><TD noWrap align=middle width=60>39</TD><TD noWrap align=middle width=48>10</TD><TD noWrap align=middle width=72>0</TD></TR></TBODY></TABLE>
                              * Elevated means the % of visits for ILI is at or above the national or region-specific baseline
                              ? National data is for current week; regional data is for the most recent three weeks.
                              ? Includes all 50 states and the District of Columbia
                              U.S. Virologic Surveillance:

                              During week 47, WHO and NREVSS laboratories located in all 50 states and Washington D.C. reported 2,080 specimens tested for influenza viruses, 52 of which were positive: ten influenza A (H1) viruses, 26 influenza A viruses that were not subtyped, and 16 influenza B viruses. Twenty-five states from eight of the nine surveillance regions have reported laboratory-confirmed influenza this season with three states accounting for 235 (76.1%) of the 309 reported influenza viruses.
                              <CENTER>
                              View WHO-NREVSS Regional Bar Charts| View Chart Data | View Full Screen </CENTER>Antigenic Characterization:

                              CDC has antigenically characterized 21 influenza viruses [20 influenza A (H1) and one influenza B virus] collected by U.S. laboratories since October 1, 2008. All influenza A (H1) viruses were antigenically related to A/Brisbane/59/2007, the A (H1N1) component selected for the 2008-09 influenza vaccine. The influenza B virus was characterized as B/Florida/04/2006-like, the influenza B component of the 2008-09 influenza vaccine.
                              It is too early in the influenza season to determine which influenza viruses will predominate or how well the vaccine and circulating strains will match.
                              Antiviral Resistance:

                              Since October 1, 2008, 21 influenza A (H1N1), five influenza A (H3N2), and eight influenza B viruses from eight states have been tested for antiviral resistance; however, 71% of the viruses tested were from only two states. Twenty of 21 influenza A (H1N1) viruses tested were resistant to oseltamivir; all 21 viruses were sensitive to zanamivir. All influenza A (H3N2) and B viruses tested were sensitive to oseltamivir and zanamivir.
                              Six influenza A (H1N1) and four influenza A (H3N2) viruses were tested for adamantane resistance. All influenza A (H1N1) viruses were sensitive to adamantanes and all influenza A (H3N2) viruses tested were resistant to adamantanes. The adamantanes are not effective against influenza B viruses.
                              Only one state has reported local influenza activity during the 2008-09 season in the United States to date, thus the number of virus specimens available for antiviral resistance testing is limited in both overall number tested and in the number of states that have submitted specimens. Currently, data on antiviral resistance, as well as the limited information on which influenza virus types or subtypes will circulate during the season, are insufficient to provide an indication of the prevalence of oseltamivir or adamantane (amantadine and rimantadine) resistance at a national or regional level. CDC has solicited a representative sample of viruses from WHO collaborating laboratories in the United States, and more specimens are expected as influenza activity increases.
                              Pneumonia and Influenza (P&I) Mortality Surveillance

                              During week 47, 6.4% of all deaths reported through the 122-Cities Mortality Reporting System were due to P&I. This percentage is below the epidemic threshold of 7.0% for week 47
                              <CENTER>
                              View Full Screen</CENTER>Influenza-Associated Pediatric Mortality

                              No influenza-associated pediatric deaths were reported during week 47.
                              <CENTER>
                              View Full Screen</CENTER>Influenza-Associated Hospitalizations

                              Laboratory-confirmed influenza-associated hospitalizations are monitored in two population-based surveillance networks: the Emerging Infections Program (EIP) and the New Vaccine Surveillance Network (NVSN). EIP and NVSN estimated rates of hospitalization for influenza will be reported every two weeks starting later this season.
                              Outpatient Illness Surveillance:

                              During week 47, 1.3% of patient visits reported through the U.S. Outpatient Influenza-like Illness Surveillance Network (ILINet) (formerly known as the U.S. Influenza Sentinel Provider Surveillance Network) were due to influenza-like illness (ILI). This percentage is less than the national baseline of 2.4%. On a regional level, the percentage of visits for ILI ranged from 0.6% to 2.4%. All nine regions reported percentages of visits for ILI below their respective region-specific baselines.
                              <CENTER>
                              View Sentinel Providers Regional Charts | View Chart Data |View Full Screen
                              </CENTER>Geographic Spread of Influenza as Assessed by State and Territorial Epidemiologists:


                              During week 47 the following influenza activity was reported:
                              • Local influenza activity was reported by one state (Hawaii)
                              • Sporadic activity was reported in the District of Columbia and 19 states (Alaska, Arizona, California, Colorado, Connecticut, Florida, Idaho, Indiana, Massachusetts, Maryland, Michigan, Nevada, New York, Oregon, Pennsylvania, Texas, Utah, Wisconsin, and Wyoming).
                              • No influenza activity was reported in 29 states (Alabama, Arkansas, Delaware, Georgia, Illinois, Iowa, Kansas, Kentucky, Louisiana, Maine, Minnesota, Mississippi, Missouri, Montana, Nebraska, New Hampshire, New Jersey, New Mexico, North Carolina, North Dakota, Ohio, Oklahoma, South Carolina, South Dakota, Tennessee, Vermont, Virginia, Washington, and West Virginia).
                              • One state (Rhode Island) did not report.

                              <OBJECT id=Banner height=420 width="100%" classid=clsid27CDB6E-AE6D-11cf-96B8-444553540000>


                              </OBJECT>
                              <SCRIPT type=text/javascript> var stamp = new Date() var movieurl = "/flu/weekly/smallmap/SmallFluActivity_v2.swf?c=FluMap&n=" + stamp.getTime(); var so = new SWFObject(movieurl, "Banner", "100%", "420", "7"); so.write("flashALTcontent"); so.addParam("scale", "noorder"); so.addParam("allowScriptAccess","sameDomain"); so.addParam("wmode", "transparent"); so.addParam("quality", "best"); so.addParam("salign", "r"); so.addParam("type", "application/x-shockwave-flash"); </SCRIPT>
                              --------------------------------------------------------------------------------
                              A description of surveillance methods is available at: http://www.cdc.gov/flu/weekly/fluactivity.htm
                              <SCRIPT type=text/javascript> <!-- function popupnr(mylink, windowname, refocus) { var mywin, href; if (typeof(mylink) == 'string') href=mylink; else href=mylink.href; mywin = window.open('', windowname, 'width=450,height=550,scrollbars=yes'); // if opened the window if ( mywin.closed || (! mywin.document.URL) || (mywin.document.URL.indexOf("about") == 0) ) mywin.location=href; else if (refocus) mywin.focus(); return false; } //--> </SCRIPT>

                              Comment


                              • Re: Seasonal Flu 2008 - 2009

                                Preliminary

                                <TABLE cellSpacing=0 cellPadding=0 width=782 border=0><TBODY><TR><TD align=middle width=780 bgColor=#0063c8 height=1>EISS - Weekly Electronic Bulletin </TD><TD width=1 bgColor=black height=1></TD></TR><TR><TD width=1 bgColor=black height=1></TD><TD width=780 bgColor=#0063c8 height=1><TABLE border=0><TBODY><TR bgColor=white><TD noWrap width=254 bgColor=#0063c8>Week 47 : 17/11/2008-23/11/2008</TD><TD noWrap align=middle width=258 bgColor=#0063c8></TD><TD noWrap align=right width=254 bgColor=#0063c8>, Issue N? 281</TD></TR></TBODY></TABLE></TD><TD width=1 bgColor=black height=1></TD></TR><TR><TD width=1 bgColor=black height=1></TD><TD width=780 bgColor=black height=1></TD><TD width=1 bgColor=black height=1></TD></TR><TR><TD width=1 bgColor=black height=1></TD><TD width=780 bgColor=#1d92ff height=3></TD><TD width=1 bgColor=black height=1></TD></TR><TR><TD width=1 bgColor=black height=1></TD><TD width=780 bgColor=black height=1></TD><TD width=1 bgColor=black height=1></TD></TR><TR><TD width=1 bgColor=black height=1></TD><TD width=780 bgColor=white><TABLE><TBODY><TR><TD>

                                </TD></TR></TBODY></TABLE></TD><TD width=1 bgColor=black height=1></TD></TR><TR><TD width=1 bgColor=black height=1></TD><TD width=780 bgColor=black height=1></TD><TD width=1 bgColor=black height=1></TD></TR></TBODY></TABLE><TABLE cellSpacing=0 cellPadding=0 width=782 border=0><TBODY><TR><TD width=1 bgColor=black height=1></TD><TD width=780 bgColor=#1d92ff height=5></TD><TD width=1 bgColor=black height=1></TD></TR><TR><TD width=1 bgColor=black height=1></TD><TD width=780 bgColor=black height=1></TD><TD width=1 bgColor=black height=1></TD></TR><TR><TD width=1 bgColor=black height=1></TD><TD width=780 bgColor=white><TABLE width=780 border=0><TBODY><TR><TD>Map

                                The map presents the intensity of influenza activity and the geographical spread as assessed by each of the networks in EISS.

                                Clicking on the map will, if available, take you through to the national web site. If 'regional' activity is reported, a pop-up text box will appear which describes the activity in greater detail.

                                Clicking on England and France will provide you with regional data.

                                <MAP name=area><AREA shape=POLY alt="Northern Ireland" coords=140,289,150,289,153,309,142,312,127,301 href="http://www.cdscni.org.uk/"><AREA shape=POLY alt=Iceland coords=88,61,88,60,83,50,72,50,59,60,56,71,56,95,6 6,106,79,120,101,118,136,105,136,84,135,69,116,65, 105,67 href="http://www.landspitali.is"><AREA shape=POLY alt=Denmark coords=173,161,176,165,171,173,170,180,169,182,163 ,181,162,176,162,167,161,164,168,160 href="http://www.ssi.dk/sw2796.asp"><AREA shape=POLY alt=Norway coords=332,79,328,90,322,100,314,114,312,120,302,1 42,296,152,288,153,279,166,257,185,255,238,266,258 ,282,259,297,245,305,238,310,240,313,240,314,227,3 22,220,322,213,318,209,322,198,318,188,314,171,318 ,153,324,148,329,149,331,145,328,137,333,130,333,1 17,345,89,341,85,347,78 href="http://www.fhi.no"><AREA shape=POLY alt=Norway coords=434,21,423,33,411,25,408,26,406,28,401,27,3 98,37,400,45,398,53,397,54,390,52,384,57,373,46,36 4,64,355,62,353,66,354,72,350,74,344,79,316,79,322 ,68,331,56,343,40,360,26,378,11,394,2,419,5,432,14 ,429,18 href="http://www.fhi.no"><AREA shape=POLY alt=Sweden coords=371,52,377,60,384,61,390,68,393,82,402,108, 390,111,310,239,314,238,315,227,322,221,321,213,31 8,209,319,206,323,199,319,192,314,171,316,167,316, 158,322,151,324,146,329,148,331,145,327,136,334,12 7,332,117,338,101,345,89,341,84,347,75,353,73,354, 69,354,62,359,62,365,63,369,52 href="http://www.smittskyddsinstitutet.se/SMItemplates/Article.aspx?id=3021"><AREA shape=POLY alt=Sweden coords=385,118,316,226,310,239,310,255,321,280,324 ,293,326,307,336,305,339,305,342,300,342,298,341,2 97,357,291,361,289,366,266,362,247,377,231,377,217 ,361,200,363,178,373,159,384,144,387,133 href="http://www.smittskyddsinstitutet.se/SMItemplates/Article.aspx?id=3021"><AREA shape=POLY alt=Denmark coords=307,260,311,273,305,279,310,286,307,295,308 ,300,314,293,323,290,326,300,325,310,326,310,319,3 19,310,319,300,314,288,314,281,311,286,305,281,302 ,281,296,272,297,273,278,284,278,285,274,294,271 href="http://www.ssi.dk/sw2796.asp"><AREA shape=POLY alt=Scotland coords=195,225,190,222,184,230,182,234,170,232,161 ,242,160,231,149,235,149,242,141,248,140,258,150,2 56,152,263,142,267,148,271,144,282,151,288,151,291 ,156,294,155,302,160,304,170,304,181,295,185,293,1 89,287,187,279,191,273,191,270,197,259,196,252,180 ,250,189,240,194,231,196,225 href="http://www.show.scot.nhs.uk/scieh/"><AREA shape=POLY alt=Scotland coords=210,199,204,206,202,209,204,217,209,217,210 ,210,211,206,214,199 href="http://www.show.scot.nhs.uk/scieh/"><AREA shape=POLY alt=Finland coords=380,209,379,213,380,216,386,215,388,212,385 ,209 href="http://www.ktl.fi"><AREA shape=POLY alt=Sweden coords=379,245,379,251,375,256,372,262,373,269,374 ,276,375,276,377,270,381,263,381,257,385,253,381,2 52,382,245 href="http://www.smittskyddsinstitutet.se/SMItemplates/Article.aspx?id=3021"><AREA onclick="return popup(this, 'notes')" shape=POLY alt=England coords=159,307,158,311,157,314,163,314,164,310,164 ,306,163,306 href="/cgi-files/regional.cgi?year=2008&week=47&region=England"><AR EA onclick="return popup(this, 'notes')" shape=POLY alt=England coords=190,287,185,291,184,294,182,294,173,302,169 ,305,171,313,174,317,172,327,170,331,171,333,182,3 32,197,329,205,328,203,317,200,312,194,306,193,289 href="/cgi-files/regional.cgi?year=2008&week=47&region=England"><AR EA onclick="return popup(this, 'notes')" shape=POLY alt=England coords=204,328,192,331,182,331,175,333,169,332,167 ,342,166,353,165,362,178,359,192,358,193,359,209,3 59,214,361,218,354,221,348,219,344,209,340,206,341 ,207,330 href="/cgi-files/regional.cgi?year=2008&week=47&region=England"><AR EA onclick="return popup(this, 'notes')" shape=POLY alt=England coords=213,360,203,359,191,359,190,358,174,359,169 ,362,165,365,159,363,147,367,141,375,133,378,133,3 83,142,383,150,380,159,384,163,377,170,380,181,381 ,200,382,212,377,215,369,210,367 href="/cgi-files/regional.cgi?year=2008&week=47&region=England"><AR EA shape=POLY alt=Wales coords=171,328,170,328,168,337,168,344,167,350,165 ,357,167,362,163,364,158,362,154,358,147,357,144,3 52,146,348,151,346,156,343,159,336,155,337,152,336 ,152,333,155,331,155,323,158,324,166,326 href="http://www2.nphs.wales.nhs.uk/icds/page.cfm?pid=507"><AREA shape=POLY alt=Ireland coords=141,287,138,284,126,285,126,290,121,292,123 ,297,123,300,114,296,107,296,105,306,103,313,108,3 18,101,328,93,331,95,345,100,348,120,346,127,343,1 36,344,142,337,145,319,143,312,137,307,136,306,134 ,307,129,303,128,300,134,293 href="http://www.ndsc.ie"><AREA shape=POLY alt="The Netherlands" coords=272,339,272,338,272,344,271,346,272,348,272 ,351,267,354,270,358,268,362,268,365,261,368,259,3 69,261,372,259,379,255,377,249,374,243,372,237,376 ,230,373,233,368,238,362,239,352,245,345,252,335,2 64,336 href="http://www.virology.nl/research/influenza.asp"><AREA shape=POLY alt=Belgium coords=258,379,259,379,258,386,262,390,262,393,257 ,399,256,402,256,407,256,407,253,406,245,400,246,3 95,242,398,239,396,236,390,232,387,229,383,225,382 ,223,379,223,375,231,372,237,376,243,372,251,373 href="http://www.iph.fgov.be/flu/"><AREA onclick="return popup(this, 'notes')" shape=POLY alt=France coords=223,376,212,378,211,391,195,396,192,401,182 ,399,181,393,172,394,174,413,164,409,159,405,144,4 05,138,408,139,422,151,428,153,434,161,435,162,442 ,168,454,174,453,178,451,179,448,177,444,180,441,1 92,442,200,448,200,452,217,453,221,450,229,450,236 ,456,244,454,248,451,252,454,262,451,268,445,272,4 43,274,431,276,424,280,419,277,416,266,413,261,407 ,254,407,246,400,246,396,242,400,240,395,235,390,2 28,383,223,382 href="/cgi-files/regional.cgi?year=2008&week=47&region=France"><ARE A onclick="return popup(this, 'notes')" shape=POLY alt=France coords=262,452,253,455,248,451,240,455,237,456,230 ,451,222,450,218,453,208,452,200,452,198,446,192,4 42,185,441,179,442,176,443,179,448,177,452,170,455 ,168,453,169,468,167,486,161,499,159,504,168,514,1 77,516,179,521,187,521,189,520,195,521,198,528,207 ,528,208,530,212,529,216,529,217,518,229,510,232,5 13,241,515,251,521,261,517,269,510,273,504,271,502 ,264,497,265,491,261,485,266,482,267,479,264,473,2 66,471,262,463,258,465,256,465,257,460,258,456 href="/cgi-files/regional.cgi?year=2008&week=47&region=France"><ARE A shape=POLY alt=Switzerland coords=306,455,302,464,301,461,302,464,301,466,295 ,463,292,466,288,472,285,469,282,465,278,469,276,4 71,269,472,266,472,265,470,262,464,257,466,254,466 ,257,456,261,452,267,445,273,441,283,441,289,439,2 95,443,296,450,302,455 href="http://www.bag.admin.ch/sentinella"><AREA shape=POLY alt=Germany coords=300,313,302,320,314,320,311,330,315,327,325 ,320,295,443,290,440,285,440,280,442,273,442,274,4 31,277,423,280,419,277,417,268,414,261,407,261,402 ,260,397,262,391,259,386,259,379,261,375,261,374,2 59,368,263,366,266,365,269,359,268,355,265,354,270 ,351,272,347,270,345,273,343,270,338,269,337,271,3 34,279,331,282,335,286,330,286,327,284,321,282,311 ,290,314,296,314 href="http://www.influenza.rki.de/agi"><AREA shape=POLY alt=Germany coords=324,321,331,316,336,319,342,331,344,341,342 ,346,342,348,346,355,348,364,347,368,352,382,347,3 84,343,383,334,391,321,395,326,400,327,408,343,423 ,331,433,333,440,325,440,315,444,311,445,307,443,3 04,446,294,442 href="http://www.influenza.rki.de/agi"><AREA shape=POLY alt=Bulgaria coords=451,492,454,498,466,495,478,493,490,489,497 ,481,519,483,520,492,516,505,523,513,513,516,509,5 16,503,523,501,531,489,534,479,533,463,538,457,529 ,451,524,450,516,455,509 href=""><AREA shape=POLY alt="Czech Republic" coords=352,381,356,383,363,386,367,385,369,388,367 ,390,371,393,372,389,374,387,380,392,388,396,396,4 01,395,404,392,410,377,418,362,419,360,417,356,416 ,349,423,340,424,340,419,326,406,326,400,321,395,3 26,395,341,385,345,383,350,383 href="http://www.szu.cz/cema/aro/aro.htm"><AREA shape=POLY alt=Slovakia coords=435,406,434,406,430,405,425,401,419,400,417 ,404,412,403,410,406,403,404,400,402,394,404,387,4 12,378,417,374,421,377,428,378,432,384,435,389,435 ,395,434,398,429,406,425,411,424,415,417,421,417,4 28,418,429,420,431,419,433,417 href="http://www.sea.host.sk/chripka.htm"><AREA shape=POLY alt=Slovenia coords=371,452,371,458,369,461,368,466,365,466,363 ,467,364,472,363,476,354,477,352,477,346,480,340,4 79,340,475,341,467,338,464,340,461,345,461,353,461 ,358,457,363,458 href="http://www.ivz.si/ivz/"><AREA shape=POLY alt=Poland coords=344,340,340,328,359,321,362,315,375,308,385 ,315,397,315,418,313,424,311,431,315,439,340,432,3 46,439,353,441,365,448,378,438,390,435,400 href="http://www.pzh.gov.pl/aindex.html"><AREA shape=POLY alt=Poland coords=436,398,435,406,430,404,426,402,419,401,417 ,405,412,403,409,407,400,403,396,402,386,396,383,3 94,376,391,373,390,371,394,366,390,368,387,364,386 ,358,386,352,381,351,374,347,366,349,365,347,362,3 45,352,341,348,342,346,343,338 href="http://www.pzh.gov.pl/aindex.html"><AREA shape=POLY alt=Hungary coords=433,416,439,421,443,422,443,424,435,432,432 ,441,427,456,419,461,416,460,412,460,406,465,401,4 66,399,468,389,469,385,466,383,464,373,457,372,450 ,373,449,373,440,375,440,373,437,375,437,377,438,3 80,432,383,433,389,435,398,432,400,429,407,425,413 ,423,416,418,426,417,431,419 href="http://www.oek.hu"><AREA onclick="return popup(this, 'notes')" shape=POLY alt=France coords=292,520,291,526,288,527,282,529,282,541,284 ,549,290,554,293,547,295,538,295,534,294,522 href="/cgi-files/regional.cgi?year=2008&week=47&region=France"><ARE A shape=POLY alt=Italy coords=345,460,336,458,328,459,322,452,318,452,313 ,453,312,457,305,456,302,460,302,466,296,462,287,4 71,283,464,276,472,265,470,263,474,268,479,261,484 ,264,491,263,496,265,500,270,503,272,504,271,510,2 78,507,284,500,329,492,329,481,335,478,341,477,341 ,471,339,465,341,462 href="http://www.virologia.unimi.it/influenza"><AREA shape=POLY alt=Italy coords=364,537,376,537,378,542,375,547,393,555,405 ,560,409,568,406,574,405,575,390,564,385,574,393,5 82,394,590,379,611,372,610,372,603,374,595,378,586 ,369,575,360,571 href="http://www.virologia.unimi.it/influenza"><AREA shape=POLY alt=Italy coords=372,603,361,606,350,609,345,606,333,607,330 ,616,337,621,347,626,358,629,361,634,370,633,372,6 24,371,617 href="http://www.virologia.unimi.it/influenza"><AREA shape=POLY alt=Italy coords=328,491,291,497,293,504,301,509,301,527,303 ,532,334,551,350,565,363,571,365,539,350,527,345,5 11,331,501 href="http://www.virologia.unimi.it/influenza"><AREA shape=POLY alt=Italy coords=291,553,294,555,298,562,298,568,296,570,296 ,586,296,592,289,592,284,598,277,593,276,588,279,5 72,275,567,275,556,279,554,281,559,286,554 href="http://www.virologia.unimi.it/influenza"><AREA shape=POLY alt=Spain coords=204,528,207,530,219,529,219,536,214,543,202 ,549,185,554,182,560,170,574,171,588,174,589,166,5 96,157,609,148,610,135,622,116,618,100,620,93,625, 80,621,79,610,74,599,202,528 href="http://www.msc.es"><AREA shape=POLY alt=Spain coords=75,600,206,528,197,526,196,523,191,519,187, 521,178,520,177,516,172,515,160,504,150,500,141,49 8,122,494,115,490,101,486,91,482,81,481,81,485,71, 485,67,491,69,512,73,512,76,510,78,510,80,515,84,5 15,87,517,91,517,93,516,94,518,98,518,97,522,101,5 25,98,529,95,529,90,533,90,538,86,550,86,553,83,55 5,81,555,80,561,81,565,81,570,77,571,76,577,78,582 ,79,583,73,586,70,590,70,599 href="http://www.msc.es"><AREA shape=POLY alt=Spain coords=227,571,221,570,220,575,216,575,212,571,206 ,573,202,576,201,581,207,582,208,586,215,583,218,5 78,230,575 href="http://www.msc.es"><AREA shape=POLY alt=Spain coords=193,583,189,582,185,586,187,591,191,594,193 ,589 href="http://www.msc.es"><AREA shape=POLY alt=Spain coords=58,616,70,616,72,616,70,627,66,627,56,622 href="http://www.msc.es"><AREA shape=POLY alt=Portugal coords=69,511,73,513,77,509,79,515,84,516,86,517,9 1,516,94,515,94,518,99,519,98,521,100,526,99,528,9 4,530,90,532,86,549,86,555,81,555,79,561,82,562,81 ,570,78,571,76,576,76,581,78,584,70,590,70,598,65, 600,53,598,48,596,33,591,34,587,38,587,44,592,49,5 94,51,587,54,573,50,570,47,564,51,553,59,542,65,53 0 href="http://www.dgsaude.pt/"><AREA shape=RECT alt="Portugal (Azores)" coords=2,544,22,559 href="http://www.dgsaude.pt/"><AREA onclick="return popup(this, 'notes')" shape=POLY alt=Greece coords=500,525,505,526,505,529,502,531,503,538,501 ,543,503,548,504,564,502,567,511,581,521,598,528,6 02,539,604,540,609,546,608,543,618,528,639,518,644 ,493,652,480,642,453,621,434,594,425,577,421,571,4 25,569,428,577,431,569,438,553,442,549,446,549,452 ,543,461,538,472,534,480,531,482,534,494,532,499,5 31 href="/cgi-files/regional.cgi?year=2008&week=47&region=Greece"><ARE A shape=POLY alt=Estonia coords=401,248,427,247,459,252,454,233,455,218,440 ,214,422,219,406,225 href="http://www.tervisekaitse.ee"><AREA shape=POLY alt=Albania coords=415,537,414,528,417,522,421,525,426,525,431 ,533,430,544,439,554,428,576,426,570,416,563,415,5 53,417,543><AREA shape=POLY alt=Macedonia coords=431,533,430,544,438,553,443,549,447,548,452 ,543,457,543,462,538,460,530,451,523,445,526><AREA shape=POLY alt=Turkey coords=679,464,671,464,663,479,653,478,642,489,621 ,490,613,486,603,481,595,483,629,583,634,578,643,5 79,652,581,658,576,660,573,657,566,663,562,667,562 ,679,554,679,554><AREA shape=POLY alt=Turkey coords=596,482,566,508,542,522,521,515,508,514,500 ,524,506,525,505,529,502,533,503,538,500,542,504,5 64,502,567,516,588,525,588,524,595,530,602,539,600 ,541,608,548,604,557,610,578,609,579,597,598,598,6 09,602,619,599,629,585><AREA shape=POLY alt=Finland coords=423,32,413,26,410,24,405,28,400,28,398,37,4 00,45,397,53,389,51,385,56,373,45,370,50,375,58,37 8,61,385,63,392,73,395,92,401,108,433,66,431,62,42 7,56,420,56,420,46,418,42,421,39 href="http://www.ktl.fi"><AREA shape=POLY alt=Finland coords=432,67,431,75,431,82,442,96,442,114,448,123 ,454,127,452,134,457,140,388,160,384,157,390,152,4 03,127,409,111,401,106 href="http://www.ktl.fi"><AREA shape=POLY alt=Finland coords=458,139,464,147,467,152,450,191,452,195,408 ,218,393,214,391,204,384,159 href="http://www.ktl.fi"><AREA shape=POLY alt=Romania coords=519,483,510,483,503,480,497,483,492,483,486 ,491,460,493,455,496,450,489,445,482,439,484,435,4 81,434,476,427,473,417,461,422,459,427,453,431,439 ,435,430,441,423 href="http://www.cantacuzino.ro"><AREA shape=POLY alt=Romania coords=516,482,520,482,520,466,528,460,528,450,520 ,450,515,456,513,457,504,447,503,431,488,418,486,4 10,481,408,473,417,464,423,460,421,441,421,441,424 href="http://www.cantacuzino.ro"><AREA shape=POLY alt=Malta coords=355,644,357,648,357,651,364,649,364,646,360 ,643 href="http://www.sahha.gov.mt"><AREA shape=POLY alt=Cyprus coords=635,595,626,604,614,607,614,612,607,617,611 ,624,624,620,629,616,636,611,631,607,639,597><AREA shape=POLY alt=Austria coords=375,419,374,422,379,432,380,435,375,438,373 ,436,372,438,373,441,372,450,361,458,358,457,352,4 61,342,460,331,458,327,457,324,453,314,453,311,458 ,297,453,295,449,294,443,298,443,303,445,308,442,3 12,445,320,441,326,439,331,441,333,438,330,433,339 ,424,344,422,348,424,357,415,360,416,363,419,372,4 18><AREA shape=POLY alt=Croatia coords=406,464,409,472,409,478,408,479,398,476,389 ,476,379,478,371,476,368,478,377,501,390,518,396,5 24,387,526,372,521,358,506,341,487,340,478,345,481 ,351,477,355,478,364,474,364,467,367,466,370,459,3 72,458,383,465,391,470,400,468 href="http://www.hzjz.hr"><AREA shape=POLY alt="Boznia and Herzegovina" coords=407,478,412,477,414,479,410,490,415,496,414 ,500,416,503,413,509,405,516,404,524,394,524,378,5 05,373,494,368,482,369,476,376,478,392,476,400,475 ><AREA shape=POLY alt=Montenegro coords=413,511,424,527,418,525,416,539,397,525><AR EA shape=POLY alt=Serbia coords=418,461,418,462,425,469,434,477,435,482,441 ,484,447,482,450,491,448,495,453,504,455,509,451,5 15,452,524,431,533,426,525,427,524,427,524,424,523 ,422,521,419,517,414,510,414,504,412,498,414,496,4 10,488,413,479,409,477,407,463,412,460 href="http://www.batut.org.yu/"><AREA shape=POLY alt="" coords=434,20,444,20,458,23,467,24,500,35,514,50,5 30,48,519,38,508,14,528,9,540,17,545,16,555,0,679, 0,679,177,451,193,452,182,459,170,466,151,461,140, 452,134,452,129,454,126,451,124,442,113,440,94,431 ,81,431,72,433,67,427,57,422,57,419,50,419,44,419, 41,423,33,424,31><AREA shape=POLY alt="" coords=452,194,457,203,448,212,456,224,451,234,457 ,245,459,253,466,270,451,282,456,293,452,309,436,3 20,440,339,434,347,448,378,680,373,680,172><AREA shape=POLY alt="" coords=449,376,437,390,434,398,434,406,432,415,441 ,423,460,421,465,423,480,411,487,410,490,420,504,4 32,504,448,514,457,521,451,527,451,536,427,543,375 ><AREA shape=POLY alt="" coords=671,463,667,453,636,442,615,434,596,429,587 ,441,573,454,560,443,552,437,535,424,541,374,679,3 71,679,465><AREA shape=POLY alt=Lithuania coords=414,278,401,286,402,300,417,300,421,304,421 ,312,428,314,433,323,439,321,450,309,452,302,456,2 92,452,283,446,279,437,275,434,278 href="http://www.aids.lt"><AREA shape=POLY alt="" coords=394,306,391,317,412,314,418,314,422,305,417 ,299,398,300><AREA shape=POLY alt=Luxembourg coords=255,400,254,407,260,408,263,402,261,395 href="http://www.ms.etat.lu/"><AREA shape=POLY alt=Latvia coords=398,283,430,279,449,281,464,270,457,251,439 ,247,423,250,396,250 href="http://www.sva.lv"><AREA shape=CIRCLE alt=Denmark coords=347,310,5 href="http://www.ssi.dk/sw2796.asp"><AREA shape=RECT alt=Norway coords=290,8,326,41 href="http://www.fhi.no"></MAP><FORM name=form1 action="" method=post>You may select the type of map :</B> Intensity <INPUT onclick="movepic('button','/bulletin_maps/2008_47_int_v2.png')" type=radio CHECKED value=radiobutton name=radiobutton> Geographical spread <INPUT onclick="movepic('button','/bulletin_maps/2008_47_v2.png')" type=radio value=radiobutton name=radiobutton> </FORM><CENTER> </CENTER>
                                <CENTER><TABLE cellSpacing=5><TBODY><TR><TD vAlign=top noWrap>A = Dominant virus A
                                H1N1 = Dominant virus A(H1N1)
                                H3N2 = Dominant virus A(H3N2)
                                H1N2 = Dominant virus A(H1N2)
                                B = Dominant virus B
                                A & B = Dominant virus A & B

                                = : stable clinical activity
                                + : increasing clinical activity
                                - : decreasing clinical activity

                                </TD><TD></TD><TD vAlign=top>Low = no influenza activity or influenza at baseline levels
                                Medium = usual levels of influenza activity
                                High = higher than usual levels of influenza activity
                                Very high = particularly severe levels of influenza activity

                                No activity = no evidence of influenza virus activity (clinical activity remains at baseline levels)
                                Sporadic = isolated cases of laboratory confirmed influenza infection
                                Local outbreak = increased influenza activity in local areas (e.g. a city) within a region,
                                or outbreaks in two or more institutions (e.g. schools) within a region. Laboratory confirmed.
                                Regional activity = influenza activity above baseline levels in one or more regions with
                                a population comprising less than 50% of the country's total population. Laboratory confirmed.
                                Widespread = influenza activity above baseline levels in one or more regions with a population
                                comprising 50% or more of the country's population. Laboratory confirmed.

                                Finland : Where available, the epidemiological data are provided by a health-care district in
                                South-Western Finland (the health-care district serves 54,000 inhabitants i.e. approximately one
                                percent of the Finnish population).
                                </TD></TR></TBODY></TABLE></CENTER>
                                </TD></TR></TBODY></TABLE></TD><TD width=1 bgColor=black height=1></TD></TR><TR><TD width=1 bgColor=black height=1></TD><TD width=780 bgColor=black height=1></TD><TD width=1 bgColor=black height=1></TD></TR></TBODY></TABLE><TABLE cellSpacing=0 cellPadding=0 width=782 border=0><TBODY><TR><TD width=1 bgColor=black height=1></TD><TD width=780 bgColor=#1d92ff height=5></TD><TD width=1 bgColor=black height=1></TD></TR><TR><TD width=1 bgColor=black height=1></TD><TD width=780 bgColor=black height=1></TD><TD width=1 bgColor=black height=1></TD></TR><TR><TD width=1 bgColor=black height=1></TD><TD width=780 bgColor=white><TABLE><TBODY><TR><TD>Network comments (where available)

                                <TABLE><TBODY><TR><TD width=20> </TD><TD width=700>Italy
                                Three further A/H3N2 influenza viruses have been isolated during this week.
                                Latvia
                                In week 47,a specimen from non-sentinel girl of 13 years old ,patient with ARI ,was positive for influenza A.It was the first laboratory- confirmed influenza case in Latvia
                                Switzerland
                                no influenza virus was detected during the week 47. One additional influenza A virus was detected during the week 46.
                                </TD></TR></TBODY></TABLE>
                                </TD></TR></TBODY></TABLE></TD><TD width=1 bgColor=black height=1></TD></TR><TR><TD width=1 bgColor=black height=1></TD><TD width=780 bgColor=black height=1></TD><TD width=1 bgColor=black height=1></TD></TR></TBODY></TABLE><TABLE cellSpacing=0 cellPadding=0 width=782 border=0><TBODY><TR><TD width=1 bgColor=black height=1></TD><TD width=780 bgColor=#1d92ff height=5></TD><TD width=1 bgColor=black height=1></TD></TR><TR><TD width=1 bgColor=black height=1></TD><TD width=780 bgColor=black height=1></TD><TD width=1 bgColor=black height=1></TD></TR><TR><TD width=1 bgColor=black height=1></TD><TD width=780 bgColor=white><TABLE width=780><TBODY><TR><TD>Table and graphs (where available)

                                <CENTER><TABLE cellSpacing=0 cellPadding=2 bgColor=white border=0><TBODY><TR><TD bgColor=#808080 colSpan=14></TD></TR><TR><TD vAlign=top bgColor=white></TD><TD vAlign=top bgColor=white>Intensity</TD><TD vAlign=top bgColor=white>Geographic
                                Spread
                                </TD><TD vAlign=top bgColor=white>Sentinel
                                swabs
                                </TD><TD vAlign=top bgColor=white>Percentage
                                positive
                                </TD><TD vAlign=top bgColor=white>Dominant
                                type
                                </TD><TD vAlign=top align=middle bgColor=white colSpan=2>ILI per
                                100,000
                                </TD><TD vAlign=top align=middle bgColor=white colSpan=2>ARI per
                                100,000
                                </TD><TD vAlign=top noWrap bgColor=white>Virology graph
                                and pie chart
                                </TD></TR><TR><TD bgColor=#808080 colSpan=13></TD></TR><TR id=r1c0><TD class=relative id=r1c1 onmouseover=crossRow_over(1,11) onmouseout=crossRow_out(1,11)>Austria</TD><TD class=relative id=r1c2 onmouseover=crossRow_over(1,11) onmouseout=crossRow_out(1,11)>Low</TD><TD class=relative id=r1c3 onmouseover=crossRow_over(1,11) onmouseout=crossRow_out(1,11)>None</TD><TD class=relative id=r1c4 onmouseover=crossRow_over(1,11) onmouseout=crossRow_out(1,11)>48</TD><TD class=relative id=r1c5 onmouseover=crossRow_over(1,11) onmouseout=crossRow_out(1,11)>2.1%</TD><TD class=relative id=r1c6 onmouseover=crossRow_over(1,11) onmouseout=crossRow_out(1,11) noWrap>None</TD><TD class=relative id=r1c7 onmouseover=crossRow_over(1,11) onmouseout=crossRow_out(1,11) align=right>876.8</TD><TD class=relative id=r1c8 onmouseover=crossRow_over(1,11) onmouseout=crossRow_out(1,11)>(graphs)</TD><TD class=relative id=r1c9 onmouseover=crossRow_over(1,11) onmouseout=crossRow_out(1,11) align=right>0.0</TD><TD class=relative id=r1c10 onmouseover=crossRow_over(1,11) onmouseout=crossRow_out(1,11)>(graphs)</TD><TD class=relative id=r1c11 onmouseover=crossRow_over(1,11) onmouseout=crossRow_out(1,11)>Click here</TD><TR id=r2c0><TD class=relative id=r2c1 onmouseover=crossRow_over(2,11) onmouseout=crossRow_out(2,11)>Belgium</TD><TD class=relative id=r2c2 onmouseover=crossRow_over(2,11) onmouseout=crossRow_out(2,11)>Low</TD><TD class=relative id=r2c3 onmouseover=crossRow_over(2,11) onmouseout=crossRow_out(2,11)>Sporadic</TD><TD class=relative id=r2c4 onmouseover=crossRow_over(2,11) onmouseout=crossRow_out(2,11)>9</TD><TD class=relative id=r2c5 onmouseover=crossRow_over(2,11) onmouseout=crossRow_out(2,11)>0%</TD><TD class=relative id=r2c6 onmouseover=crossRow_over(2,11) onmouseout=crossRow_out(2,11) noWrap>None</TD><TD class=relative id=r2c7 onmouseover=crossRow_over(2,11) onmouseout=crossRow_out(2,11) align=right>90.7</TD><TD class=relative id=r2c8 onmouseover=crossRow_over(2,11) onmouseout=crossRow_out(2,11)>(graphs)</TD><TD class=relative id=r2c9 onmouseover=crossRow_over(2,11) onmouseout=crossRow_out(2,11) align=right>1834.3</TD><TD class=relative id=r2c10 onmouseover=crossRow_over(2,11) onmouseout=crossRow_out(2,11)>(graphs)</TD><TD class=relative id=r2c11 onmouseover=crossRow_over(2,11) onmouseout=crossRow_out(2,11)>Click here</TD><TR id=r3c0><TD class=relative id=r3c1 onmouseover=crossRow_over(3,11) onmouseout=crossRow_out(3,11)>Bulgaria</TD><TD class=relative id=r3c2 onmouseover=crossRow_over(3,11) onmouseout=crossRow_out(3,11)>Low</TD><TD class=relative id=r3c3 onmouseover=crossRow_over(3,11) onmouseout=crossRow_out(3,11)>None</TD><TD class=relative id=r3c4 onmouseover=crossRow_over(3,11) onmouseout=crossRow_out(3,11)>0</TD><TD class=relative id=r3c5 onmouseover=crossRow_over(3,11) onmouseout=crossRow_out(3,11)>0%</TD><TD class=relative id=r3c6 onmouseover=crossRow_over(3,11) onmouseout=crossRow_out(3,11) noWrap>None</TD><TD class=relative id=r3c7 onmouseover=crossRow_over(3,11) onmouseout=crossRow_out(3,11) align=right>0.0 </TD><TD class=relative id=r3c8 onmouseover=crossRow_over(3,11) onmouseout=crossRow_out(3,11)>(graphs)</TD><TD class=relative id=r3c9 onmouseover=crossRow_over(3,11) onmouseout=crossRow_out(3,11) align=right>1007.9 </TD><TD class=relative id=r3c10 onmouseover=crossRow_over(3,11) onmouseout=crossRow_out(3,11)>(graphs)</TD><TD class=relative id=r3c11 onmouseover=crossRow_over(3,11) onmouseout=crossRow_out(3,11)>Click here</TD><TR id=r4c0><TD class=relative id=r4c1 onmouseover=crossRow_over(4,11) onmouseout=crossRow_out(4,11)>Czech Republic</TD><TD class=relative id=r4c2 onmouseover=crossRow_over(4,11) onmouseout=crossRow_out(4,11)>Low</TD><TD class=relative id=r4c3 onmouseover=crossRow_over(4,11) onmouseout=crossRow_out(4,11)>None</TD><TD class=relative id=r4c4 onmouseover=crossRow_over(4,11) onmouseout=crossRow_out(4,11)>34</TD><TD class=relative id=r4c5 onmouseover=crossRow_over(4,11) onmouseout=crossRow_out(4,11)>0%</TD><TD class=relative id=r4c6 onmouseover=crossRow_over(4,11) onmouseout=crossRow_out(4,11) noWrap>None</TD><TD class=relative id=r4c7 onmouseover=crossRow_over(4,11) onmouseout=crossRow_out(4,11) align=right>22.4 </TD><TD class=relative id=r4c8 onmouseover=crossRow_over(4,11) onmouseout=crossRow_out(4,11)>(graphs)</TD><TD class=relative id=r4c9 onmouseover=crossRow_over(4,11) onmouseout=crossRow_out(4,11) align=right>948.3 </TD><TD class=relative id=r4c10 onmouseover=crossRow_over(4,11) onmouseout=crossRow_out(4,11)>(graphs)</TD><TD class=relative id=r4c11 onmouseover=crossRow_over(4,11) onmouseout=crossRow_out(4,11)>Click here</TD><TR id=r5c0><TD class=relative id=r5c1 onmouseover=crossRow_over(5,11) onmouseout=crossRow_out(5,11)>Denmark</TD><TD class=relative id=r5c2 onmouseover=crossRow_over(5,11) onmouseout=crossRow_out(5,11)>Low</TD><TD class=relative id=r5c3 onmouseover=crossRow_over(5,11) onmouseout=crossRow_out(5,11)>Sporadic</TD><TD class=relative id=r5c4 onmouseover=crossRow_over(5,11) onmouseout=crossRow_out(5,11)>4</TD><TD class=relative id=r5c5 onmouseover=crossRow_over(5,11) onmouseout=crossRow_out(5,11)>0%</TD><TD class=relative id=r5c6 onmouseover=crossRow_over(5,11) onmouseout=crossRow_out(5,11) noWrap>None</TD><TD class=relative id=r5c7 onmouseover=crossRow_over(5,11) onmouseout=crossRow_out(5,11) align=right>30.1 </TD><TD class=relative id=r5c8 onmouseover=crossRow_over(5,11) onmouseout=crossRow_out(5,11)>(graphs)</TD><TD class=relative id=r5c9 onmouseover=crossRow_over(5,11) onmouseout=crossRow_out(5,11) align=right>0.0 </TD><TD class=relative id=r5c10 onmouseover=crossRow_over(5,11) onmouseout=crossRow_out(5,11)>(graphs)</TD><TD class=relative id=r5c11 onmouseover=crossRow_over(5,11) onmouseout=crossRow_out(5,11)>Click here</TD><TR id=r6c0><TD class=relative id=r6c1 onmouseover=crossRow_over(6,11) onmouseout=crossRow_out(6,11)>England</TD><TD class=relative id=r6c2 onmouseover=crossRow_over(6,11) onmouseout=crossRow_out(6,11)>Low</TD><TD class=relative id=r6c3 onmouseover=crossRow_over(6,11) onmouseout=crossRow_out(6,11)>Sporadic</TD><TD class=relative id=r6c4 onmouseover=crossRow_over(6,11) onmouseout=crossRow_out(6,11)>69</TD><TD class=relative id=r6c5 onmouseover=crossRow_over(6,11) onmouseout=crossRow_out(6,11)>23.2%</TD><TD class=relative id=r6c6 onmouseover=crossRow_over(6,11) onmouseout=crossRow_out(6,11) noWrap>Type A, Subtype H3</TD><TD class=relative id=r6c7 onmouseover=crossRow_over(6,11) onmouseout=crossRow_out(6,11) align=right>12.6 </TD><TD class=relative id=r6c8 onmouseover=crossRow_over(6,11) onmouseout=crossRow_out(6,11)>(graphs)</TD><TD class=relative id=r6c9 onmouseover=crossRow_over(6,11) onmouseout=crossRow_out(6,11) align=right>703.5 </TD><TD class=relative id=r6c10 onmouseover=crossRow_over(6,11) onmouseout=crossRow_out(6,11)>(graphs)</TD><TD class=relative id=r6c11 onmouseover=crossRow_over(6,11) onmouseout=crossRow_out(6,11)>Click here</TD><TR id=r7c0><TD class=relative id=r7c1 onmouseover=crossRow_over(7,11) onmouseout=crossRow_out(7,11)>Estonia</TD><TD class=relative id=r7c2 onmouseover=crossRow_over(7,11) onmouseout=crossRow_out(7,11)>Low</TD><TD class=relative id=r7c3 onmouseover=crossRow_over(7,11) onmouseout=crossRow_out(7,11)>None</TD><TD class=relative id=r7c4 onmouseover=crossRow_over(7,11) onmouseout=crossRow_out(7,11)>6</TD><TD class=relative id=r7c5 onmouseover=crossRow_over(7,11) onmouseout=crossRow_out(7,11)>0%</TD><TD class=relative id=r7c6 onmouseover=crossRow_over(7,11) onmouseout=crossRow_out(7,11) noWrap>None</TD><TD class=relative id=r7c7 onmouseover=crossRow_over(7,11) onmouseout=crossRow_out(7,11) align=right>0.8</TD><TD class=relative id=r7c8 onmouseover=crossRow_over(7,11) onmouseout=crossRow_out(7,11)>(graphs)</TD><TD class=relative id=r7c9 onmouseover=crossRow_over(7,11) onmouseout=crossRow_out(7,11) align=right>293.0</TD><TD class=relative id=r7c10 onmouseover=crossRow_over(7,11) onmouseout=crossRow_out(7,11)>(graphs)</TD><TD class=relative id=r7c11 onmouseover=crossRow_over(7,11) onmouseout=crossRow_out(7,11)>Click here</TD><TR id=r9c0><TD class=relative id=r9c1 onmouseover=crossRow_over(9,11) onmouseout=crossRow_out(9,11)>Germany</TD><TD class=relative id=r9c2 onmouseover=crossRow_over(9,11) onmouseout=crossRow_out(9,11)>Low</TD><TD class=relative id=r9c3 onmouseover=crossRow_over(9,11) onmouseout=crossRow_out(9,11)>None</TD><TD class=relative id=r9c4 onmouseover=crossRow_over(9,11) onmouseout=crossRow_out(9,11)>30</TD><TD class=relative id=r9c5 onmouseover=crossRow_over(9,11) onmouseout=crossRow_out(9,11)>3.3%</TD><TD class=relative id=r9c6 onmouseover=crossRow_over(9,11) onmouseout=crossRow_out(9,11) noWrap>None</TD><TD class=relative id=r9c7 onmouseover=crossRow_over(9,11) onmouseout=crossRow_out(9,11) align=right>0.0 </TD><TD class=relative id=r9c8 onmouseover=crossRow_over(9,11) onmouseout=crossRow_out(9,11)>(graphs)</TD><TD class=relative id=r9c9 onmouseover=crossRow_over(9,11) onmouseout=crossRow_out(9,11) align=right>854.0 </TD><TD class=relative id=r9c10 onmouseover=crossRow_over(9,11) onmouseout=crossRow_out(9,11)>(graphs)</TD><TD class=relative id=r9c11 onmouseover=crossRow_over(9,11) onmouseout=crossRow_out(9,11)>Click here</TD><TR id=r10c0><TD class=relative id=r10c1 onmouseover=crossRow_over(10,11) onmouseout=crossRow_out(10,11)>Greece</TD><TD class=relative id=r10c2 onmouseover=crossRow_over(10,11) onmouseout=crossRow_out(10,11)>Low</TD><TD class=relative id=r10c3 onmouseover=crossRow_over(10,11) onmouseout=crossRow_out(10,11)>None</TD><TD class=relative id=r10c4 onmouseover=crossRow_over(10,11) onmouseout=crossRow_out(10,11)>0</TD><TD class=relative id=r10c5 onmouseover=crossRow_over(10,11) onmouseout=crossRow_out(10,11)>0%</TD><TD class=relative id=r10c6 onmouseover=crossRow_over(10,11) onmouseout=crossRow_out(10,11) noWrap>None</TD><TD class=relative id=r10c7 onmouseover=crossRow_over(10,11) onmouseout=crossRow_out(10,11) align=right>52.5</TD><TD class=relative id=r10c8 onmouseover=crossRow_over(10,11) onmouseout=crossRow_out(10,11)>(graphs)</TD><TD class=relative id=r10c9 onmouseover=crossRow_over(10,11) onmouseout=crossRow_out(10,11) align=right>0.0</TD><TD class=relative id=r10c10 onmouseover=crossRow_over(10,11) onmouseout=crossRow_out(10,11)>(graphs)</TD><TD class=relative id=r10c11 onmouseover=crossRow_over(10,11) onmouseout=crossRow_out(10,11)>Click here</TD><TR id=r11c0><TD class=relative id=r11c1 onmouseover=crossRow_over(11,11) onmouseout=crossRow_out(11,11)>Hungary</TD><TD class=relative id=r11c2 onmouseover=crossRow_over(11,11) onmouseout=crossRow_out(11,11)>Low</TD><TD class=relative id=r11c3 onmouseover=crossRow_over(11,11) onmouseout=crossRow_out(11,11)>None</TD><TD class=relative id=r11c4 onmouseover=crossRow_over(11,11) onmouseout=crossRow_out(11,11)>15</TD><TD class=relative id=r11c5 onmouseover=crossRow_over(11,11) onmouseout=crossRow_out(11,11)>0%</TD><TD class=relative id=r11c6 onmouseover=crossRow_over(11,11) onmouseout=crossRow_out(11,11) noWrap>None</TD><TD class=relative id=r11c7 onmouseover=crossRow_over(11,11) onmouseout=crossRow_out(11,11) align=right>100.6</TD><TD class=relative id=r11c8 onmouseover=crossRow_over(11,11) onmouseout=crossRow_out(11,11)>(graphs)</TD><TD class=relative id=r11c9 onmouseover=crossRow_over(11,11) onmouseout=crossRow_out(11,11) align=right>0.0</TD><TD class=relative id=r11c11 onmouseover=crossRow_over(11,11) onmouseout=crossRow_out(11,11)>(graphs)</TD><TD class=relative id=r11c11 onmouseover=crossRow_over(11,11) onmouseout=crossRow_out(11,11)>Click here</TD><TR id=r12c0><TD class=relative id=r12c1 onmouseover=crossRow_over(12,11) onmouseout=crossRow_out(12,11)>Ireland</TD><TD class=relative id=r12c2 onmouseover=crossRow_over(12,11) onmouseout=crossRow_out(12,11)>Low</TD><TD class=relative id=r12c3 onmouseover=crossRow_over(12,11) onmouseout=crossRow_out(12,11)>Sporadic</TD><TD class=relative id=r12c4 onmouseover=crossRow_over(12,11) onmouseout=crossRow_out(12,11)>8</TD><TD class=relative id=r12c5 onmouseover=crossRow_over(12,11) onmouseout=crossRow_out(12,11)>12.5%</TD><TD class=relative id=r12c6 onmouseover=crossRow_over(12,11) onmouseout=crossRow_out(12,11) noWrap>Type B</TD><TD class=relative id=r12c7 onmouseover=crossRow_over(12,11) onmouseout=crossRow_out(12,11) align=right>10.8 </TD><TD class=relative id=r12c8 onmouseover=crossRow_over(12,11) onmouseout=crossRow_out(12,11)>(graphs)</TD><TD class=relative id=r12c9 onmouseover=crossRow_over(12,11) onmouseout=crossRow_out(12,11) align=right>0.0 </TD><TD class=relative id=r12c10 onmouseover=crossRow_over(12,11) onmouseout=crossRow_out(12,11)>(graphs)</TD><TD class=relative id=r12c11 onmouseover=crossRow_over(12,11) onmouseout=crossRow_out(12,11)>Click here</TD><TR id=r13c0><TD class=relative id=r13c1 onmouseover=crossRow_over(13,11) onmouseout=crossRow_out(13,11)>Italy</TD><TD class=relative id=r13c2 onmouseover=crossRow_over(13,11) onmouseout=crossRow_out(13,11)></TD><TD class=relative id=r13c3 onmouseover=crossRow_over(13,11) onmouseout=crossRow_out(13,11)></TD><TD class=relative id=r13c4 onmouseover=crossRow_over(13,11) onmouseout=crossRow_out(13,11)>11</TD><TD class=relative id=r13c5 onmouseover=crossRow_over(13,11) onmouseout=crossRow_out(13,11)>9.1%</TD><TD class=relative id=r13c6 onmouseover=crossRow_over(13,11) onmouseout=crossRow_out(13,11) noWrap>None</TD><TD class=relative id=r13c7 onmouseover=crossRow_over(13,11) onmouseout=crossRow_out(13,11) align=right></TD><TD class=relative id=r13c8 onmouseover=crossRow_over(13,11) onmouseout=crossRow_out(13,11)>(graphs)</TD><TD class=relative id=r13c9 onmouseover=crossRow_over(13,11) onmouseout=crossRow_out(13,11) noWrap></TD><TD class=relative id=r13c10 onmouseover=crossRow_over(13,11) onmouseout=crossRow_out(13,11)></TD><TD class=relative id=r13c11 onmouseover=crossRow_over(13,11) onmouseout=crossRow_out(13,11)>Click here</TD><TR id=r14c0><TD class=relative id=r14c1 onmouseover=crossRow_over(14,11) onmouseout=crossRow_out(14,11)>Latvia</TD><TD class=relative id=r14c2 onmouseover=crossRow_over(14,11) onmouseout=crossRow_out(14,11)>Low</TD><TD class=relative id=r14c3 onmouseover=crossRow_over(14,11) onmouseout=crossRow_out(14,11)>None</TD><TD class=relative id=r14c4 onmouseover=crossRow_over(14,11) onmouseout=crossRow_out(14,11)>1</TD><TD class=relative id=r14c5 onmouseover=crossRow_over(14,11) onmouseout=crossRow_out(14,11)>0%</TD><TD class=relative id=r14c6 onmouseover=crossRow_over(14,11) onmouseout=crossRow_out(14,11) noWrap>None</TD><TD class=relative id=r14c7 onmouseover=crossRow_over(14,11) onmouseout=crossRow_out(14,11) align=right>0.0 </TD><TD class=relative id=r14c8 onmouseover=crossRow_over(14,11) onmouseout=crossRow_out(14,11)>(graphs)</TD><TD class=relative id=r14c9 onmouseover=crossRow_over(14,11) onmouseout=crossRow_out(14,11) align=right>717.2 </TD><TD class=relative id=r14c10 onmouseover=crossRow_over(14,11) onmouseout=crossRow_out(14,11)>(graphs)</TD><TD class=relative id=r14c11 onmouseover=crossRow_over(14,11) onmouseout=crossRow_out(14,11)>Click here</TD><TR id=r15c0><TD class=relative id=r15c1 onmouseover=crossRow_over(15,11) onmouseout=crossRow_out(15,11)>Lithuania</TD><TD class=relative id=r15c2 onmouseover=crossRow_over(15,11) onmouseout=crossRow_out(15,11)>Low</TD><TD class=relative id=r15c3 onmouseover=crossRow_over(15,11) onmouseout=crossRow_out(15,11)>None</TD><TD class=relative id=r15c4 onmouseover=crossRow_over(15,11) onmouseout=crossRow_out(15,11)>0</TD><TD class=relative id=r15c5 onmouseover=crossRow_over(15,11) onmouseout=crossRow_out(15,11)>0%</TD><TD class=relative id=r15c6 onmouseover=crossRow_over(15,11) onmouseout=crossRow_out(15,11) noWrap>None</TD><TD class=relative id=r15c7 onmouseover=crossRow_over(15,11) onmouseout=crossRow_out(15,11) align=right>0.2 </TD><TD class=relative id=r15c8 onmouseover=crossRow_over(15,11) onmouseout=crossRow_out(15,11)>(graphs)</TD><TD class=relative id=r15c9 onmouseover=crossRow_over(15,11) onmouseout=crossRow_out(15,11) align=right>446.4 </TD><TD class=relative id=r15c10 onmouseover=crossRow_over(15,11) onmouseout=crossRow_out(15,11)>(graphs)</TD><TD class=relative id=r15c11 onmouseover=crossRow_over(15,11) onmouseout=crossRow_out(15,11)>Click here</TD><TR id=r16c0><TD class=relative id=r16c1 onmouseover=crossRow_over(16,11) onmouseout=crossRow_out(16,11)>Luxembourg</TD><TD class=relative id=r16c2 onmouseover=crossRow_over(16,11) onmouseout=crossRow_out(16,11)>Low</TD><TD class=relative id=r16c3 onmouseover=crossRow_over(16,11) onmouseout=crossRow_out(16,11)>None</TD><TD class=relative id=r16c4 onmouseover=crossRow_over(16,11) onmouseout=crossRow_out(16,11)>6</TD><TD class=relative id=r16c5 onmouseover=crossRow_over(16,11) onmouseout=crossRow_out(16,11)>0%</TD><TD class=relative id=r16c6 onmouseover=crossRow_over(16,11) onmouseout=crossRow_out(16,11) noWrap>None</TD><TD class=relative id=r16c7 onmouseover=crossRow_over(16,11) onmouseout=crossRow_out(16,11) align=right>46.5 </TD><TD class=relative id=r16c8 onmouseover=crossRow_over(16,11) onmouseout=crossRow_out(16,11)>(graphs)</TD><TD class=relative id=r16c9 onmouseover=crossRow_over(16,11) onmouseout=crossRow_out(16,11) align=right>2604.7 </TD><TD class=relative id=r16c10 onmouseover=crossRow_over(16,11) onmouseout=crossRow_out(16,11)>(graphs)</TD><TD class=relative id=r16c11 onmouseover=crossRow_over(16,11) onmouseout=crossRow_out(16,11)>Click here</TD><TR id=r18c0><TD class=relative id=r18c1 onmouseover=crossRow_over(18,11) style="BACKGROUND: #ffffff; CURSOR: hand" onmouseout=crossRow_out(18,11)>Netherlands</TD><TD class=relative id=r18c2 onmouseover=crossRow_over(18,11) style="BACKGROUND: #ffffff; CURSOR: hand" onmouseout=crossRow_out(18,11)>Low</TD><TD class=relative id=r18c3 onmouseover=crossRow_over(18,11) style="BACKGROUND: #ffffff; CURSOR: hand" onmouseout=crossRow_out(18,11)>None</TD><TD class=relative id=r18c4 onmouseover=crossRow_over(18,11) style="BACKGROUND: #ffffff; CURSOR: hand" onmouseout=crossRow_out(18,11)>6</TD><TD class=relative id=r18c5 onmouseover=crossRow_over(18,11) style="BACKGROUND: #ffffff; CURSOR: hand" onmouseout=crossRow_out(18,11)>0%</TD><TD class=relative id=r18c6 onmouseover=crossRow_over(18,11) style="BACKGROUND: #ffffff; CURSOR: hand" onmouseout=crossRow_out(18,11) noWrap>None</TD><TD class=relative id=r18c7 onmouseover=crossRow_over(18,11) style="BACKGROUND: #ffffff; CURSOR: hand" onmouseout=crossRow_out(18,11) align=right>45.4 </TD><TD class=relative id=r18c8 onmouseover=crossRow_over(18,11) style="BACKGROUND: #ffffff; CURSOR: hand" onmouseout=crossRow_out(18,11)>(graphs)</TD><TD class=relative id=r18c9 onmouseover=crossRow_over(18,11) style="BACKGROUND: #ffffff; CURSOR: hand" onmouseout=crossRow_out(18,11) align=right>0.0 </TD><TD class=relative id=r18c10 onmouseover=crossRow_over(18,11) style="BACKGROUND: #ffffff; CURSOR: hand" onmouseout=crossRow_out(18,11)>(graphs)</TD><TD class=relative id=r18c11 onmouseover=crossRow_over(18,11) style="BACKGROUND: #ffffff; CURSOR: hand" onmouseout=crossRow_out(18,11)>Click here</TD><TR id=r19c0><TD class=relative id=r19c1 onmouseover=crossRow_over(19,11) onmouseout=crossRow_out(19,11)>Northern Ireland</TD><TD class=relative id=r19c2 onmouseover=crossRow_over(19,11) onmouseout=crossRow_out(19,11)>Low</TD><TD class=relative id=r19c3 onmouseover=crossRow_over(19,11) onmouseout=crossRow_out(19,11)>Sporadic</TD><TD class=relative id=r19c4 onmouseover=crossRow_over(19,11) onmouseout=crossRow_out(19,11)>5</TD><TD class=relative id=r19c5 onmouseover=crossRow_over(19,11) onmouseout=crossRow_out(19,11)>40.0%</TD><TD class=relative id=r19c6 onmouseover=crossRow_over(19,11) onmouseout=crossRow_out(19,11) noWrap>Type A, Subtype H3</TD><TD class=relative id=r19c7 onmouseover=crossRow_over(19,11) onmouseout=crossRow_out(19,11) align=right>41.4 </TD><TD class=relative id=r19c8 onmouseover=crossRow_over(19,11) onmouseout=crossRow_out(19,11)>(graphs)</TD><TD class=relative id=r19c9 onmouseover=crossRow_over(19,11) onmouseout=crossRow_out(19,11) align=right>0.0 </TD><TD class=relative id=r19c10 onmouseover=crossRow_over(19,11) onmouseout=crossRow_out(19,11)>(graphs)</TD><TD class=relative id=r19c11 onmouseover=crossRow_over(19,11) onmouseout=crossRow_out(19,11)>Click here</TD><TR id=r20c0><TD class=relative id=r20c1 onmouseover=crossRow_over(20,11) onmouseout=crossRow_out(20,11)>Norway</TD><TD class=relative id=r20c2 onmouseover=crossRow_over(20,11) onmouseout=crossRow_out(20,11)>Low</TD><TD class=relative id=r20c3 onmouseover=crossRow_over(20,11) onmouseout=crossRow_out(20,11)>Sporadic</TD><TD class=relative id=r20c4 onmouseover=crossRow_over(20,11) onmouseout=crossRow_out(20,11)>0</TD><TD class=relative id=r20c5 onmouseover=crossRow_over(20,11) onmouseout=crossRow_out(20,11)>0%</TD><TD class=relative id=r20c6 onmouseover=crossRow_over(20,11) onmouseout=crossRow_out(20,11) noWrap>Type A, Subtype H1 and H3</TD><TD class=relative id=r20c7 onmouseover=crossRow_over(20,11) onmouseout=crossRow_out(20,11) align=right>35.9 </TD><TD class=relative id=r20c8 onmouseover=crossRow_over(20,11) onmouseout=crossRow_out(20,11)>(graphs)</TD><TD class=relative id=r20c9 onmouseover=crossRow_over(20,11) onmouseout=crossRow_out(20,11) align=right>0.0 </TD><TD class=relative id=r20c10 onmouseover=crossRow_over(20,11) onmouseout=crossRow_out(20,11)>(graphs)</TD><TD class=relative id=r20c11 onmouseover=crossRow_over(20,11) onmouseout=crossRow_out(20,11)>Click here</TD><TR id=r21c0><TD class=relative id=r21c1 onmouseover=crossRow_over(21,11) style="BACKGROUND: #ffffff; CURSOR: hand" onmouseout=crossRow_out(21,11)>Poland</TD><TD class=relative id=r21c2 onmouseover=crossRow_over(21,11) style="BACKGROUND: #ffffff; CURSOR: hand" onmouseout=crossRow_out(21,11)>Low</TD><TD class=relative id=r21c3 onmouseover=crossRow_over(21,11) style="BACKGROUND: #ffffff; CURSOR: hand" onmouseout=crossRow_out(21,11)>None</TD><TD class=relative id=r21c4 onmouseover=crossRow_over(21,11) style="BACKGROUND: #ffffff; CURSOR: hand" onmouseout=crossRow_out(21,11)>21</TD><TD class=relative id=r21c5 onmouseover=crossRow_over(21,11) style="BACKGROUND: #ffffff; CURSOR: hand" onmouseout=crossRow_out(21,11)>0%</TD><TD class=relative id=r21c6 onmouseover=crossRow_over(21,11) style="BACKGROUND: #ffffff; CURSOR: hand" onmouseout=crossRow_out(21,11) noWrap>None</TD><TD class=relative id=r21c7 onmouseover=crossRow_over(21,11) style="BACKGROUND: #ffffff; CURSOR: hand" onmouseout=crossRow_out(21,11) align=right>33.1 </TD><TD class=relative id=r21c8 onmouseover=crossRow_over(21,11) style="BACKGROUND: #ffffff; CURSOR: hand" onmouseout=crossRow_out(21,11)>(graphs)</TD><TD class=relative id=r21c9 onmouseover=crossRow_over(21,11) style="BACKGROUND: #ffffff; CURSOR: hand" onmouseout=crossRow_out(21,11) align=right>0.0 </TD><TD class=relative id=r21c10 onmouseover=crossRow_over(21,11) style="BACKGROUND: #ffffff; CURSOR: hand" onmouseout=crossRow_out(21,11)>(graphs)</TD><TD class=relative id=r21c11 onmouseover=crossRow_over(21,11) style="BACKGROUND: #ffffff; CURSOR: hand" onmouseout=crossRow_out(21,11)>Click here</TD><TR id=r22c0><TD class=relative id=r22c1 onmouseover=crossRow_over(22,11) style="BACKGROUND: #ffffff; CURSOR: hand" onmouseout=crossRow_out(22,11)>Portugal</TD><TD class=relative id=r22c2 onmouseover=crossRow_over(22,11) style="BACKGROUND: #ffffff; CURSOR: hand" onmouseout=crossRow_out(22,11)>Low</TD><TD class=relative id=r22c3 onmouseover=crossRow_over(22,11) style="BACKGROUND: #ffffff; CURSOR: hand" onmouseout=crossRow_out(22,11)>None</TD><TD class=relative id=r22c4 onmouseover=crossRow_over(22,11) style="BACKGROUND: #ffffff; CURSOR: hand" onmouseout=crossRow_out(22,11)>7</TD><TD class=relative id=r22c5 onmouseover=crossRow_over(22,11) style="BACKGROUND: #ffffff; CURSOR: hand" onmouseout=crossRow_out(22,11)>28.6%</TD><TD class=relative id=r22c6 onmouseover=crossRow_over(22,11) style="BACKGROUND: #ffffff; CURSOR: hand" onmouseout=crossRow_out(22,11) noWrap>Type A</TD><TD class=relative id=r22c7 onmouseover=crossRow_over(22,11) style="BACKGROUND: #ffffff; CURSOR: hand" onmouseout=crossRow_out(22,11) align=right>3.2 </TD><TD class=relative id=r22c8 onmouseover=crossRow_over(22,11) style="BACKGROUND: #ffffff; CURSOR: hand" onmouseout=crossRow_out(22,11)>(graphs)</TD><TD class=relative id=r22c9 onmouseover=crossRow_over(22,11) style="BACKGROUND: #ffffff; CURSOR: hand" onmouseout=crossRow_out(22,11) align=right>0.0 </TD><TD class=relative id=r22c10 onmouseover=crossRow_over(22,11) style="BACKGROUND: #ffffff; CURSOR: hand" onmouseout=crossRow_out(22,11)>(graphs)</TD><TD class=relative id=r22c11 onmouseover=crossRow_over(22,11) style="BACKGROUND: #ffffff; CURSOR: hand" onmouseout=crossRow_out(22,11)>Click here</TD><TR id=r23c0><TD class=relative id=r23c1 onmouseover=crossRow_over(23,11) onmouseout=crossRow_out(23,11)>Romania</TD><TD class=relative id=r23c2 onmouseover=crossRow_over(23,11) onmouseout=crossRow_out(23,11)>Low</TD><TD class=relative id=r23c3 onmouseover=crossRow_over(23,11) onmouseout=crossRow_out(23,11)>None</TD><TD class=relative id=r23c4 onmouseover=crossRow_over(23,11) onmouseout=crossRow_out(23,11)>12</TD><TD class=relative id=r23c5 onmouseover=crossRow_over(23,11) onmouseout=crossRow_out(23,11)>0%</TD><TD class=relative id=r23c6 onmouseover=crossRow_over(23,11) onmouseout=crossRow_out(23,11) noWrap>None</TD><TD class=relative id=r23c7 onmouseover=crossRow_over(23,11) onmouseout=crossRow_out(23,11) align=right>0.2 </TD><TD class=relative id=r23c8 onmouseover=crossRow_over(23,11) onmouseout=crossRow_out(23,11)>(graphs)</TD><TD class=relative id=r23c9 onmouseover=crossRow_over(23,11) onmouseout=crossRow_out(23,11) align=right>981.5 </TD><TD class=relative id=r23c10 onmouseover=crossRow_over(23,11) onmouseout=crossRow_out(23,11)>(graphs)</TD><TD class=relative id=r23c11 onmouseover=crossRow_over(23,11) onmouseout=crossRow_out(23,11)>Click here</TD><TR id=r25c0><TD class=relative id=r25c1 onmouseover=crossRow_over(25,11) onmouseout=crossRow_out(25,11)>Serbia</TD><TD class=relative id=r25c2 onmouseover=crossRow_over(25,11) onmouseout=crossRow_out(25,11)>Low</TD><TD class=relative id=r25c3 onmouseover=crossRow_over(25,11) onmouseout=crossRow_out(25,11)>None</TD><TD class=relative id=r25c4 onmouseover=crossRow_over(25,11) onmouseout=crossRow_out(25,11)>3</TD><TD class=relative id=r25c5 onmouseover=crossRow_over(25,11) onmouseout=crossRow_out(25,11)>0%</TD><TD class=relative id=r25c6 onmouseover=crossRow_over(25,11) onmouseout=crossRow_out(25,11) noWrap>None</TD><TD class=relative id=r25c7 onmouseover=crossRow_over(25,11) onmouseout=crossRow_out(25,11) align=right>40.3</TD><TD class=relative id=r25c8 onmouseover=crossRow_over(25,11) onmouseout=crossRow_out(25,11)>(graphs)</TD><TD class=relative id=r25c9 onmouseover=crossRow_over(25,11) onmouseout=crossRow_out(25,11) align=right>0.0</TD><TD class=relative id=r25c10 onmouseover=crossRow_over(25,11) onmouseout=crossRow_out(25,11)>(graphs)</TD><TD class=relative id=r25c11 onmouseover=crossRow_over(25,11) onmouseout=crossRow_out(25,11)>Click here</TD><TR id=r26c0><TD class=relative id=r26c1 onmouseover=crossRow_over(26,11) style="BACKGROUND: #ffffff; CURSOR: hand" onmouseout=crossRow_out(26,11)>Slovakia</TD><TD class=relative id=r26c2 onmouseover=crossRow_over(26,11) style="BACKGROUND: #ffffff; CURSOR: hand" onmouseout=crossRow_out(26,11)>Low</TD><TD class=relative id=r26c3 onmouseover=crossRow_over(26,11) style="BACKGROUND: #ffffff; CURSOR: hand" onmouseout=crossRow_out(26,11)>None</TD><TD class=relative id=r26c4 onmouseover=crossRow_over(26,11) style="BACKGROUND: #ffffff; CURSOR: hand" onmouseout=crossRow_out(26,11)>1</TD><TD class=relative id=r26c5 onmouseover=crossRow_over(26,11) style="BACKGROUND: #ffffff; CURSOR: hand" onmouseout=crossRow_out(26,11)>0%</TD><TD class=relative id=r26c6 onmouseover=crossRow_over(26,11) style="BACKGROUND: #ffffff; CURSOR: hand" onmouseout=crossRow_out(26,11) noWrap>Type A</TD><TD class=relative id=r26c7 onmouseover=crossRow_over(26,11) style="BACKGROUND: #ffffff; CURSOR: hand" onmouseout=crossRow_out(26,11) align=right>161.4 </TD><TD class=relative id=r26c8 onmouseover=crossRow_over(26,11) style="BACKGROUND: #ffffff; CURSOR: hand" onmouseout=crossRow_out(26,11)>(graphs)</TD><TD class=relative id=r26c9 onmouseover=crossRow_over(26,11) style="BACKGROUND: #ffffff; CURSOR: hand" onmouseout=crossRow_out(26,11) align=right>1430.4 </TD><TD class=relative id=r26c10 onmouseover=crossRow_over(26,11) style="BACKGROUND: #ffffff; CURSOR: hand" onmouseout=crossRow_out(26,11)>(graphs)</TD><TD class=relative id=r26c11 onmouseover=crossRow_over(26,11) style="BACKGROUND: #ffffff; CURSOR: hand" onmouseout=crossRow_out(26,11)>Click here</TD><TR id=r27c0><TD class=relative id=r27c1 onmouseover=crossRow_over(27,11) onmouseout=crossRow_out(27,11)>Slovenia</TD><TD class=relative id=r27c2 onmouseover=crossRow_over(27,11) onmouseout=crossRow_out(27,11)>Low</TD><TD class=relative id=r27c3 onmouseover=crossRow_over(27,11) onmouseout=crossRow_out(27,11)>None</TD><TD class=relative id=r27c4 onmouseover=crossRow_over(27,11) onmouseout=crossRow_out(27,11)>6</TD><TD class=relative id=r27c5 onmouseover=crossRow_over(27,11) onmouseout=crossRow_out(27,11)>0%</TD><TD class=relative id=r27c6 onmouseover=crossRow_over(27,11) onmouseout=crossRow_out(27,11) noWrap>None</TD><TD class=relative id=r27c7 onmouseover=crossRow_over(27,11) onmouseout=crossRow_out(27,11) align=right>0.0 </TD><TD class=relative id=r27c8 onmouseover=crossRow_over(27,11) onmouseout=crossRow_out(27,11)>(graphs)</TD><TD class=relative id=r27c9 onmouseover=crossRow_over(27,11) onmouseout=crossRow_out(27,11) align=right>1017.1 </TD><TD class=relative id=r27c10 onmouseover=crossRow_over(27,11) onmouseout=crossRow_out(27,11)>(graphs)</TD><TD class=relative id=r27c11 onmouseover=crossRow_over(27,11) onmouseout=crossRow_out(27,11)>Click here</TD><TR id=r28c0><TD class=relative id=r28c1 onmouseover=crossRow_over(28,11) onmouseout=crossRow_out(28,11)>Spain</TD><TD class=relative id=r28c2 onmouseover=crossRow_over(28,11) onmouseout=crossRow_out(28,11)>Low</TD><TD class=relative id=r28c3 onmouseover=crossRow_over(28,11) onmouseout=crossRow_out(28,11)>Sporadic</TD><TD class=relative id=r28c4 onmouseover=crossRow_over(28,11) onmouseout=crossRow_out(28,11)>69</TD><TD class=relative id=r28c5 onmouseover=crossRow_over(28,11) onmouseout=crossRow_out(28,11)>17.4%</TD><TD class=relative id=r28c6 onmouseover=crossRow_over(28,11) onmouseout=crossRow_out(28,11) noWrap>Type A, Subtype H3N2</TD><TD class=relative id=r28c7 onmouseover=crossRow_over(28,11) onmouseout=crossRow_out(28,11) align=right>32.1 </TD><TD class=relative id=r28c8 onmouseover=crossRow_over(28,11) onmouseout=crossRow_out(28,11)>(graphs)</TD><TD class=relative id=r28c9 onmouseover=crossRow_over(28,11) onmouseout=crossRow_out(28,11) align=right>0.0 </TD><TD class=relative id=r28c10 onmouseover=crossRow_over(28,11) onmouseout=crossRow_out(28,11)>(graphs)</TD><TD class=relative id=r28c11 onmouseover=crossRow_over(28,11) onmouseout=crossRow_out(28,11)>Click here</TD><TR id=r29c0><TD class=relative id=r29c1 onmouseover=crossRow_over(29,11) onmouseout=crossRow_out(29,11)>Sweden</TD><TD class=relative id=r29c2 onmouseover=crossRow_over(29,11) onmouseout=crossRow_out(29,11)>Low</TD><TD class=relative id=r29c3 onmouseover=crossRow_over(29,11) onmouseout=crossRow_out(29,11)>Sporadic</TD><TD class=relative id=r29c4 onmouseover=crossRow_over(29,11) onmouseout=crossRow_out(29,11)>52</TD><TD class=relative id=r29c5 onmouseover=crossRow_over(29,11) onmouseout=crossRow_out(29,11)>7.7%</TD><TD class=relative id=r29c6 onmouseover=crossRow_over(29,11) onmouseout=crossRow_out(29,11) noWrap>Type A</TD><TD class=relative id=r29c7 onmouseover=crossRow_over(29,11) onmouseout=crossRow_out(29,11) align=right>3.1 </TD><TD class=relative id=r29c8 onmouseover=crossRow_over(29,11) onmouseout=crossRow_out(29,11)>(graphs)</TD><TD class=relative id=r29c9 onmouseover=crossRow_over(29,11) onmouseout=crossRow_out(29,11) align=right>0.0 </TD><TD class=relative id=r29c10 onmouseover=crossRow_over(29,11) onmouseout=crossRow_out(29,11)>(graphs)</TD><TD class=relative id=r29c11 onmouseover=crossRow_over(29,11) onmouseout=crossRow_out(29,11)>Click here</TD><TR id=r30c0><TD class=relative id=r30c1 onmouseover=crossRow_over(30,11) style="BACKGROUND: #ffffff; CURSOR: hand" onmouseout=crossRow_out(30,11)>Switzerland</TD><TD class=relative id=r30c2 onmouseover=crossRow_over(30,11) style="BACKGROUND: #ffffff; CURSOR: hand" onmouseout=crossRow_out(30,11)>Low</TD><TD class=relative id=r30c3 onmouseover=crossRow_over(30,11) style="BACKGROUND: #ffffff; CURSOR: hand" onmouseout=crossRow_out(30,11)>Sporadic</TD><TD class=relative id=r30c4 onmouseover=crossRow_over(30,11) style="BACKGROUND: #ffffff; CURSOR: hand" onmouseout=crossRow_out(30,11)>12</TD><TD class=relative id=r30c5 onmouseover=crossRow_over(30,11) style="BACKGROUND: #ffffff; CURSOR: hand" onmouseout=crossRow_out(30,11)>0%</TD><TD class=relative id=r30c6 onmouseover=crossRow_over(30,11) style="BACKGROUND: #ffffff; CURSOR: hand" onmouseout=crossRow_out(30,11) noWrap>Type A</TD><TD class=relative id=r30c7 onmouseover=crossRow_over(30,11) style="BACKGROUND: #ffffff; CURSOR: hand" onmouseout=crossRow_out(30,11) align=right>14.5 </TD><TD class=relative id=r30c8 onmouseover=crossRow_over(30,11) style="BACKGROUND: #ffffff; CURSOR: hand" onmouseout=crossRow_out(30,11)>(graphs)</TD><TD class=relative id=r30c9 onmouseover=crossRow_over(30,11) style="BACKGROUND: #ffffff; CURSOR: hand" onmouseout=crossRow_out(30,11) noWrap></TD><TD class=relative id=r30c10 onmouseover=crossRow_over(30,11) style="BACKGROUND: #ffffff; CURSOR: hand" onmouseout=crossRow_out(30,11)></TD><TD class=relative id=r30c11 onmouseover=crossRow_over(30,11) style="BACKGROUND: #ffffff; CURSOR: hand" onmouseout=crossRow_out(30,11)>Click here</TD><TR id=r31c0><TD class=relative id=r31c1 onmouseover=crossRow_over(31,11) onmouseout=crossRow_out(31,11)>Wales</TD><TD class=relative id=r31c2 onmouseover=crossRow_over(31,11) onmouseout=crossRow_out(31,11)>Low</TD><TD class=relative id=r31c3 onmouseover=crossRow_over(31,11) onmouseout=crossRow_out(31,11)>None</TD><TD class=relative id=r31c4 onmouseover=crossRow_over(31,11) onmouseout=crossRow_out(31,11)></TD><TD class=relative id=r31c5 onmouseover=crossRow_over(31,11) onmouseout=crossRow_out(31,11)></TD><TD class=relative id=r31c6 onmouseover=crossRow_over(31,11) onmouseout=crossRow_out(31,11) noWrap></TD><TD class=relative id=r31c7 onmouseover=crossRow_over(31,11) onmouseout=crossRow_out(31,11) align=right>2.7 </TD><TD class=relative id=r31c8 onmouseover=crossRow_over(31,11) onmouseout=crossRow_out(31,11)>(graphs)</TD><TD class=relative id=r31c9 onmouseover=crossRow_over(31,11) onmouseout=crossRow_out(31,11) align=right>0.0 </TD><TD class=relative id=r31c10 onmouseover=crossRow_over(31,11) onmouseout=crossRow_out(31,11)>(graphs)</TD><TD class=relative id=r31c11 onmouseover=crossRow_over(31,11) onmouseout=crossRow_out(31,11)>Click here</TD><TR id=r32c0><TD class=relative id=r32c1 onmouseover=crossRow_over(32,11) onmouseout=crossRow_out(32,11)>Europe</TD><TD class=relative id=r32c2 onmouseover=crossRow_over(32,11) onmouseout=crossRow_out(32,11)></TD><TD class=relative id=r32c3 onmouseover=crossRow_over(32,11) onmouseout=crossRow_out(32,11)></TD><TD class=relative id=r32c4 onmouseover=crossRow_over(32,11) onmouseout=crossRow_out(32,11)>435</TD><TD class=relative id=r32c5 onmouseover=crossRow_over(32,11) onmouseout=crossRow_out(32,11)>9.2%</TD><TD class=relative id=r32c6 onmouseover=crossRow_over(32,11) onmouseout=crossRow_out(32,11) noWrap></TD><TD class=relative id=r32c7 onmouseover=crossRow_over(32,11) onmouseout=crossRow_out(32,11) align=right></TD><TD class=relative id=r32c8 onmouseover=crossRow_over(32,11) onmouseout=crossRow_out(32,11)></TD><TD class=relative id=r32c9 onmouseover=crossRow_over(32,11) onmouseout=crossRow_out(32,11) noWrap></TD><TD class=relative id=r32c10 onmouseover=crossRow_over(32,11) onmouseout=crossRow_out(32,11)></TD><TD class=relative id=r32c11 onmouseover=crossRow_over(32,11) onmouseout=crossRow_out(32,11)>Click here</TD><TR><TD bgColor=#808080 colSpan=14></TD></TR><TR><TD colSpan=14>Preliminary data</TD><TR><TD colSpan=14>
                                Intensity: Low = no influenza activity or influenza activity at baseline level; Medium= usual levels of influenza activity; High = higher than usual levels of influenza activity; Very high = particularly severe levels of influenza activity.
                                Percentage positive: percentage of sentinel swabs that tested positive for influenza A or B
                                Dominant type: this assessment is based on data from sentinel and non-sentinel sources
                                ARI: acute respiratory infection
                                ILI: influenza-like illness
                                Population: per 100,000 population
                                </TD></TR></TBODY></TABLE></CENTER>
                                </TD></TR></TBODY></TABLE></TD><TD width=1 bgColor=black height=1></TD></TR><TR><TD width=1 bgColor=black height=1></TD><TD width=780 bgColor=black height=1></TD><TD width=1 bgColor=black height=1></TD></TR></TBODY></TABLE><TABLE cellSpacing=0 cellPadding=0 width=782 border=0><TBODY><TR><TD width=1 bgColor=black height=1></TD><TD width=780 bgColor=#1d92ff height=5></TD><TD width=1 bgColor=black height=1></TD></TR><TR><TD width=1 bgColor=black height=1></TD><TD width=780 bgColor=black height=1></TD><TD width=1 bgColor=black height=1></TD></TR><TR><TD width=1 bgColor=black height=1></TD><TD width=780 bgColor=white><TABLE><TBODY><TR><TD><TABLE><TBODY><TR><TD>The bulletin text was written by an editorial team at the European Centre for Disease Prevention and Control (ECDC) and the Community Network of Reference Laboratories for Human Influenza in Europe (CNRL). Team members are Flaviu Plata, Phillip Zucs and Bruno Ciancio from ECDC, and Adam, Meijer Rod Daniels Alan Hay and Maria Zambon from CNRL. The bulletin text was reviewed by Olav Hungnes (Norwegian Institute of Public Health, Oslo, Norway), and Anne Mazick (Statens Serum Institut, Copenhagen, Denmark) on behalf of the EISS members.

                                Neither the European Centre for Disease Prevention and Control (ECDC), nor any person acting on his behalf is liable for the use that may be made of the information contained in this bulletin. Maps and commentary used in this Bulletin do not imply any opinions whatsoever of ECDC or its partners on the legal status of the countries and territories shown or concerning their borders.
                                </TD></TR></TBODY></TABLE>
                                </TD></TR></TBODY></TABLE></TD><TD width=1 bgColor=black height=1></TD></TR><TR><TD width=1 bgColor=black height=1></TD><TD width=780 bgColor=black height=1></TD><TD width=1 bgColor=black height=1></TD></TR><TR><TD width=1 bgColor=black height=1></TD><TD align=middle width=780 bgColor=#0063c8>EISS : Weekly Electronic Bulletin</TD></TR></TBODY></TABLE>

                                Comment

                                Working...
                                X