Announcement

Collapse
No announcement yet.

Seasonal Flu 2008 - 2009

Collapse
X
 
  • Filter
  • Time
  • Show
Clear All
new posts

  • Re: Seasonal Flu 2008 - 2009

    Originally posted by AlaskaDenise View Post
    Why does it appear there is more antiviral resistance in H1N1 and not H3N2?

    .
    The level of antiviral resistance is actually near 100% in H1N1 and H3N2. In H3N2 the resistance is to the amantadines and is primarily S31N. This change is also in clade 2C of H1N1.

    For Tamiflu (oseltamivir) the level is 100% in clade 2B.

    Thus, in Europe and North America virtually all seasonal flu has antiviral resistance.

    H274Y in H1N1 likely came from H5N1, but after showing up in clade 2C in China, it jumped from clade to clade via recombination, before hitchhiking with the dominant H1N1 sub-clade, which is now dominant in Europe and North America.
    Comment


    • Re: Seasonal Flu 2008 - 2009

      2008-2009 Influenza Season Week 48 ending November 29, 2008
      (All data are preliminary and may change as more reports are received.)
      Synopsis:

      During week 48 (November 23-29, 2008), a low level of influenza activity was reported in the United States.
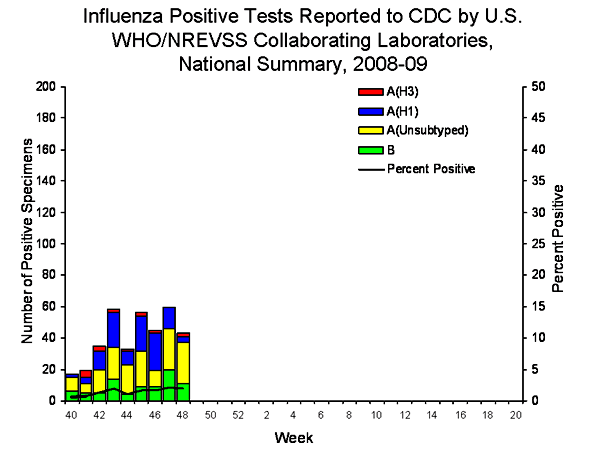
      • Forty-three (2.0%) specimens tested by U.S. World Health Organization (WHO) and National Respiratory and Enteric Virus Surveillance System (NREVSS) collaborating laboratories, and reported to CDC/Influenza Division, were positive for influenza.
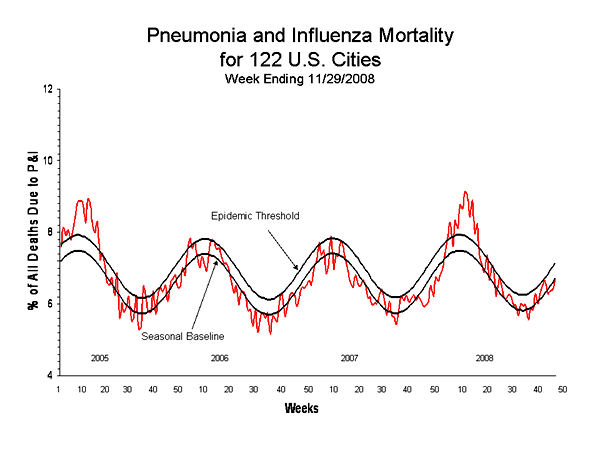
      • The proportion of deaths attributed to pneumonia and influenza (P&I) was below the epidemic threshold.
      • The proportion of outpatient visits for influenza-like illness (ILI) was below national and region-specific baseline levels.
      • One state reported local influenza activity; Puerto Rico and 22 states reported sporadic influenza activity; and the District of Columbia and 27 states reported no influenza activity.
      <TABLE class=table cellSpacing=0 cellPadding=3 align=center border=0><CAPTION>National and Regional Summary of Select Surveillance Components

      </CAPTION><TBODY><TR vAlign=top><TH vAlign=bottom width=85 rowSpan=2>
      Region
      </TH><TH noWrap align=middle width=300 colSpan=3>Data for current week</STRONG></TH><TH noWrap align=middle width=276 colSpan=5>Data cumulative for the season</TH></TR><TR vAlign=top><TH align=middle width=72>Out-patient ILI*</TH><TH align=middle width=72>% positive for flu?</TH><TH align=middle width=96>Number of jurisdictions reporting regional or widespread activity?</TH><TH noWrap align=middle width=48>A (H1)</TH><TH noWrap align=middle width=48>A (H3)</TH><TH align=middle width=60>A Unsub-typed</TH><TH noWrap align=middle width=48>B</TH><TH align=middle width=72>Pediatric Deaths</TH></TR><TR><TD align=left width=85>Nation</TD><TD noWrap align=middle width=72>Normal</TD><TD noWrap align=middle width=72>2.0 % </TD><TD noWrap align=middle width=96>0 of 51 </TD><TD noWrap align=middle width=48>112</TD><TD noWrap align=middle width=48>16</TD><TD noWrap align=middle width=60>154</TD><TD noWrap align=middle width=48>83</TD><TD noWrap align=middle width=72>0</TD></TR><TR><TD align=left width=85>New England</TD><TD noWrap align=middle width=72>Normal</TD><TD noWrap align=middle width=72>0.6 % </TD><TD noWrap align=middle width=96>0 of 6</TD><TD noWrap align=middle width=48>0</TD><TD noWrap align=middle width=48>1</TD><TD noWrap align=middle width=60>5</TD><TD noWrap align=middle width=48>1</TD><TD noWrap align=middle width=72>0</TD></TR><TR><TD align=left width=85>Mid-Atlantic</TD><TD noWrap align=middle width=72>Normal</TD><TD noWrap align=middle width=72>0.1 % </TD><TD noWrap align=middle width=96>0 of 3</TD><TD noWrap align=middle width=48>2</TD><TD noWrap align=middle width=48>0</TD><TD noWrap align=middle width=60>2</TD><TD noWrap align=middle width=48>1</TD><TD noWrap align=middle width=72>0</TD></TR><TR><TD align=left width=85>East North Central</TD><TD noWrap align=middle width=72>Normal</TD><TD noWrap align=middle width=72>4.5 % </TD><TD noWrap align=middle width=96>0 of 5</TD><TD noWrap align=middle width=48>4</TD><TD noWrap align=middle width=48>0</TD><TD noWrap align=middle width=60>3</TD><TD noWrap align=middle width=48>6</TD><TD noWrap align=middle width=72>0</TD></TR><TR><TD align=left width=85>West North Central</TD><TD noWrap align=middle width=72>Normal</TD><TD noWrap align=middle width=72>0.0 % </TD><TD noWrap align=middle width=96>0 of 7</TD><TD noWrap align=middle width=48>0</TD><TD noWrap align=middle width=48>0</TD><TD noWrap align=middle width=60>2</TD><TD noWrap align=middle width=48>1</TD><TD noWrap align=middle width=72>0</TD></TR><TR><TD align=left width=85>South Atlantic</TD><TD noWrap align=middle width=72>Normal</TD><TD noWrap align=middle width=72>2.1 % </TD><TD noWrap align=middle width=96>0 of 9</TD><TD noWrap align=middle width=48>8</TD><TD noWrap align=middle width=48>2</TD><TD noWrap align=middle width=60>53</TD><TD noWrap align=middle width=48>32</TD><TD noWrap align=middle width=72>0</TD></TR><TR><TD align=left width=85>East South Central</TD><TD noWrap align=middle width=72>Normal</TD><TD noWrap align=middle width=72>0.0 % </TD><TD noWrap align=middle width=96>0 of 4</TD><TD noWrap align=middle width=48>0</TD><TD noWrap align=middle width=48>0</TD><TD noWrap align=middle width=60>0</TD><TD noWrap align=middle width=48>0</TD><TD noWrap align=middle width=72>0</TD></TR><TR><TD align=left width=85>West South Central</TD><TD noWrap align=middle width=72>Normal</TD><TD noWrap align=middle width=72>5.9 % </TD><TD noWrap align=middle width=96>0 of 4</TD><TD noWrap align=middle width=48>18</TD><TD noWrap align=middle width=48>0</TD><TD noWrap align=middle width=60>41</TD><TD noWrap align=middle width=48>27</TD><TD noWrap align=middle width=72>0</TD></TR><TR><TD align=left width=85>Mountain</TD><TD noWrap align=middle width=72>Normal</TD><TD noWrap align=middle width=72>2.1 % </TD><TD noWrap align=middle width=96>0 of 8</TD><TD noWrap align=middle width=48>4</TD><TD noWrap align=middle width=48>9</TD><TD noWrap align=middle width=60>10</TD><TD noWrap align=middle width=48>4</TD><TD noWrap align=middle width=72>0</TD></TR><TR><TD align=left width=85>Pacific</TD><TD noWrap align=middle width=72>Normal</TD><TD noWrap align=middle width=72>3.4 % </TD><TD noWrap align=middle width=96>0 of 5</TD><TD noWrap align=middle width=48>76</TD><TD noWrap align=middle width=48>4</TD><TD noWrap align=middle width=60>38</TD><TD noWrap align=middle width=48>11</TD><TD noWrap align=middle width=72>0</TD></TR></TBODY></TABLE>
      * Elevated means the % of visits for ILI is at or above the national or region-specific baseline
      ? National data is for current week; regional data is for the most recent three weeks.
      ? Includes all 50 states and the District of Columbia
      U.S. Virologic Surveillance:

      WHO and NREVSS collaborating laboratories located in all 50 states and Washington D.C. report to CDC the number of respiratory specimens tested for influenza each week. Results of these tests performed during the current week, and cumulative totals for the season, are summarized in the table below.
      <TABLE class=table cellSpacing=0 cellPadding=3 align=center border=0><TBODY><TR><TH align=left width=150></TH><TH noWrap align=middle width=150>Week 48</TH><TH noWrap align=middle width=150>Cumulative for the Season</TH></TR><TR><TD align=left width=170>No. of specimens tested</TD><TD noWrap align=middle width=150>2136</TD><TD noWrap align=middle width=150>24657</TD></TR><TR><TD align=left width=200>No. of positive specimens (%)</TD><TD noWrap align=middle width=150>43 (2.0%)</TD><TD noWrap align=middle width=150>365 (1.5%)</TD></TR><TR><TD align=left colSpan=3>Positive specimens by type/subtype</TD></TR><TR><TD align=left width=150>Influenza A</TD><TD noWrap align=middle width=150>32 (74.4%)</TD><TD noWrap align=middle width=150>282 (77.3%)</TD></TR><TR><TD align=left width=150> A (H1)</TD><TD noWrap align=middle width=150>4 (12.1%)</TD><TD noWrap align=middle width=150>112 (39.7%)</TD></TR><TR><TD align=left width=150> A (H3)</TD><TD noWrap align=middle width=150>2 (6.1%)</TD><TD noWrap align=middle width=150>16 (5.7%)</TD></TR><TR><TD align=left width=150> A (unsubtyped)</TD><TD noWrap align=middle width=150>26 (78.8%)</TD><TD noWrap align=middle width=150>154 (54.6%)</TD></TR><TR><TD align=left width=150>Influenza B</TD><TD noWrap align=middle width=150>11 (25.6%)</TD><TD noWrap align=middle width=150>83 (22.7%)</TD></TR></TBODY></TABLE>
      Twenty-six states from eight of the nine surveillance regions have reported laboratory-confirmed influenza this season with three states accounting for 275 (75.3%) of the 365 reported influenza viruses.
      <CENTER>
      View WHO-NREVSS Regional Bar Charts| View Chart Data | View Full Screen </CENTER>Antigenic Characterization:

      CDC has antigenically characterized 30 influenza viruses [20 influenza A (H1), three influenza A (H3) and seven influenza B viruses] collected by U.S. laboratories since October 1, 2008.
      All influenza A (H1) viruses were characterized as A/Brisbane/59/2007-like and all influenza A (H3) viruses were characterized as A/Brisbane/10/2007-like, the influenza A (H1N1) and influenza A (H3N2) components included in the 2008-09 influenza vaccine.
      Influenza B viruses currently circulating can be divided into two antigenically distinct lineages represented by the B/Yamagata/16/88 and B/Victoria/02/87 viruses. Four influenza B viruses were characterized as B/Florida/04/2006-like, belonging to the B/Yamagata lineage, the influenza B component of the 2008-09 influenza vaccine, while the remaining three viruses belong to the B/Victoria lineage.
      Data on antigenic characterization should be interpreted with caution given that:
      1. Few U.S. isolates are available for testing because of limited flu activity thus far.
      2. The majority of viruses antigenically characterized to date come from only two states and may not be nationally representative.
      3. Antigenic characterization data is based on hemagglutination inhibition (HI) testing using a panel of reference ferret antisera and results may not correlate with clinical protection against circulating viruses provided by influenza vaccination.
      Annual influenza vaccination is expected to provide the best protection against those virus strains which are most similar to the vaccine strains, but can also provide at least partial protection against strains that are related, but antigenically distinct from vaccine strains. Limited to no protection may be expected when the vaccine and circulating virus strains are so different as to be from different lineages, as is seen with the two lineages of influenza B viruses.
      Antiviral Resistance:

      Since October 1, 2008, 25 influenza A (H1N1), five influenza A (H3N2), and nine influenza B viruses from 11 states have been tested for antiviral resistance; however, 72% of the viruses tested were from only two states. Twenty-four of 25 influenza A (H1N1) viruses tested were resistant to oseltamivir; while all 25 viruses were sensitive to zanamivir. All influenza A (H3N2) and B viruses tested were sensitive to oseltamivir and zanamivir.
      Twenty-five influenza A (H1N1) and five influenza A (H3N2) viruses were tested for adamantane resistance. All influenza A (H1N1) viruses were sensitive to the adamantanes. All influenza A (H3N2) viruses tested were resistant to the adamantanes. The adamantanes are not effective against influenza B viruses.
      Only one state has reported local influenza activity during the 2008-09 season in the United States to date, thus the number of virus specimens available for antiviral resistance testing is limited in both the overall number tested and in the number of states that have submitted specimens. Limited data on antiviral resistance, as well as the uncertainty regarding which influenza virus types or subtypes will circulate during the season, make it impossible to provide an indication of the prevalence of influenza viruses resistance to oseltamivir or the adamantanes (amantadine and rimantadine) nationally or regionally at this time. CDC has solicited a representative sample of viruses from WHO collaborating laboratories in the United States, and more specimens are expected as influenza activity increases.
      Pneumonia and Influenza (P&I) Mortality Surveillance

      During week 48, 6.7% of all deaths reported through the 122-Cities Mortality Reporting System were due to P&I. This percentage is below the epidemic threshold of 7.1% for week 48.
      <CENTER>
      View Full Screen</CENTER>Influenza-Associated Pediatric Mortality

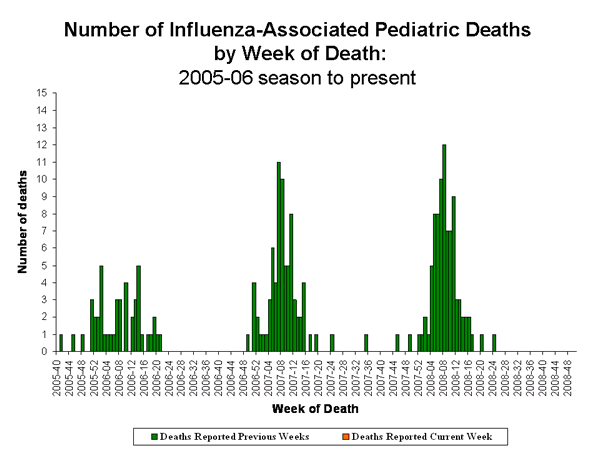
      No influenza-associated pediatric deaths were reported during week 48.
      <CENTER>
      View Full Screen</CENTER>Influenza-Associated Hospitalizations

      Laboratory-confirmed influenza-associated hospitalizations are monitored in two population-based surveillance networks: the Emerging Infections Program (EIP) and the New Vaccine Surveillance Network (NVSN). EIP and NVSN estimated rates of hospitalization for influenza will be reported every two weeks starting later this season.
      Outpatient Illness Surveillance:

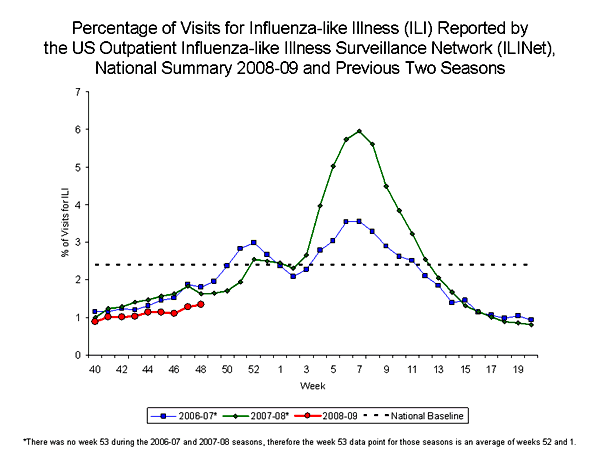
      During week 48, 1.3% of patient visits reported through the U.S. Outpatient Influenza-like Illness Surveillance Network (ILINet) (formerly known as the U.S. Influenza Sentinel Provider Surveillance Network) were due to influenza-like illness (ILI). This percentage is less than the national baseline of 2.4%. On a regional level, the percentage of visits for ILI ranged from 0.4% to 2.4%. All nine regions reported percentages of visits for ILI below their respective region-specific baselines.
      <CENTER>
      View Sentinel Providers Regional Charts | View Chart Data |View Full Screen
      </CENTER>Geographic Spread of Influenza as Assessed by State and Territorial Epidemiologists:


      During week 48 the following influenza activity was reported:
      • Local influenza activity was reported by one state (Hawaii).
      • Sporadic activity was reported in Puerto Rico and 22 states (Alaska, Arizona, Arkansas, California, Colorado, Connecticut, Florida, Idaho, Indiana, Massachusetts, Maryland, Michigan, New Hampshire, New York, Oregon, Pennsylvania, Rhode Island, South Dakota, Texas, Utah, West Virginia, and Wisconsin).
      • No influenza activity was reported in the District of Columbia and 27 states (Alabama, Delaware, Georgia, Illinois, Iowa, Kansas, Kentucky, Louisiana, Maine, Minnesota, Mississippi, Missouri, Montana, Nebraska, Nevada, New Jersey, New Mexico, North Carolina, North Dakota, Ohio, Oklahoma, South Carolina, Tennessee, Vermont, Virginia, Washington, and Wyoming).

      <OBJECT id=Banner height=420 width="100%" classid=clsid27CDB6E-AE6D-11cf-96B8-444553540000>


      </OBJECT>
      <SCRIPT type=text/javascript> var stamp = new Date() var movieurl = "/flu/weekly/smallmap/SmallFluActivity_v2.swf?c=FluMap&n=" + stamp.getTime(); var so = new SWFObject(movieurl, "Banner", "100%", "420", "7"); so.write("flashALTcontent"); so.addParam("scale", "noorder"); so.addParam("allowScriptAccess","sameDomain"); so.addParam("wmode", "transparent"); so.addParam("quality", "best"); so.addParam("salign", "r"); so.addParam("type", "application/x-shockwave-flash"); </SCRIPT>
      --------------------------------------------------------------------------------
      A description of surveillance methods is available at: http://www.cdc.gov/flu/weekly/fluactivity.htm
      <SCRIPT type=text/javascript> <!-- function popupnr(mylink, windowname, refocus) { var mywin, href; if (typeof(mylink) == 'string') href=mylink; else href=mylink.href; mywin = window.open('', windowname, 'width=450,height=550,scrollbars=yes'); // if opened the window if ( mywin.closed || (! mywin.document.URL) || (mywin.document.URL.indexOf("about") == 0) ) mywin.location=href; else if (refocus) mywin.focus(); return false; } //--> </SCRIPT>

      Comment


      • Re: Seasonal Flu 2008 - 2009

        <TABLE border=1><CAPTION>INFLUENZA VIRUSES ISOLATED BY
        WHO/NREVSS Collaborating Laboratories
        2008 - 2009 Season
        </CAPTION><TBODY><TR><TH id=header1 width=70>Week</TH><TH id=header2 width=90>A(H1)</TH><TH id=header3 width=70>A(H3)</TH><TH id=header4 width=70>A(Unk)</TH><TH id=header5 width=70>B </TH><TH id=header6 align=right>Total # Tested</TH><TH id=header7 align=right>% Positive</TH></TR><TR><TD align=right headers=header1>40 </TD><TD align=right headers=header2>2 </TD><TD align=right headers=header3>0 </TD><TD align=right headers=header4>9 </TD><TD align=right headers=header5>6 </TD><TD align=right headers=header6>2520 </TD><TD align=right headers=header7>0.67 </TD></TR><TR><TD align=right headers=header1>41 </TD><TD align=right headers=header2>4 </TD><TD align=right headers=header3>4 </TD><TD align=right headers=header4>6 </TD><TD align=right headers=header5>5 </TD><TD align=right headers=header6>2541 </TD><TD align=right headers=header7>0.75 </TD></TR><TR><TD align=right headers=header1>42 </TD><TD align=right headers=header2>12 </TD><TD align=right headers=header3>3 </TD><TD align=right headers=header4>15 </TD><TD align=right headers=header5>5 </TD><TD align=right headers=header6>2667 </TD><TD align=right headers=header7>1.31 </TD></TR><TR><TD align=right headers=header1>43 </TD><TD align=right headers=header2>22 </TD><TD align=right headers=header3>2 </TD><TD align=right headers=header4>20 </TD><TD align=right headers=header5>14 </TD><TD align=right headers=header6>2896 </TD><TD align=right headers=header7>2 </TD></TR><TR><TD align=right headers=header1>44 </TD><TD align=right headers=header2>9 </TD><TD align=right headers=header3>1 </TD><TD align=right headers=header4>19 </TD><TD align=right headers=header5>4 </TD><TD align=right headers=header6>2969 </TD><TD align=right headers=header7>1.11 </TD></TR><TR><TD align=right headers=header1>45 </TD><TD align=right headers=header2>22 </TD><TD align=right headers=header3>2 </TD><TD align=right headers=header4>23 </TD><TD align=right headers=header5>9 </TD><TD align=right headers=header6>3404 </TD><TD align=right headers=header7>1.65 </TD></TR><TR><TD align=right headers=header1>46 </TD><TD align=right headers=header2>24 </TD><TD align=right headers=header3>2 </TD><TD align=right headers=header4>10 </TD><TD align=right headers=header5>9 </TD><TD align=right headers=header6>2626 </TD><TD align=right headers=header7>1.71 </TD></TR><TR><TD align=right headers=header1>47 </TD><TD align=right headers=header2>13 </TD><TD align=right headers=header3>0 </TD><TD align=right headers=header4>26 </TD><TD align=right headers=header5>20 </TD><TD align=right headers=header6>2898 </TD><TD align=right headers=header7>2.04 </TD></TR><TR><TD align=right headers=header1>48 </TD><TD align=right headers=header2>4 </TD><TD align=right headers=header3>2 </TD><TD align=right headers=header4>26 </TD><TD align=right headers=header5>11 </TD><TD align=right headers=header6>2136 </TD><TD align=right headers=header7>2.01 </TD></TR></TBODY></TABLE>
        Return to Current Report

        Comment


        • Re: Seasonal Flu 2008 - 2009

          Commentary

          Comment


          • Re: Seasonal Flu 2008 - 2009

            Commentary

            H1N1 Tamiflu Resistance in the United States Increases to 96&#37;
            Recombinomics Commentary 23:38
            December 5, 2008

            Twenty-four of 25 influenza A (H1N1) viruses tested were resistant to oseltamivir

            Twenty-five influenza A (H1N1) and five influenza A (H3N2) viruses were tested for adamantane resistance. All influenza A (H1N1) viruses were sensitive to the adamantanes. All influenza A (H3N2) viruses tested were resistant to the adamantanes.

            The above comments from the CDC week 48 report indicates the four most recently tested H1N1 isolates were oseltamivir resistant, raising the frequency in the United States to 96% and extending the streak of Tamiflu resistance to the 23 most recently tested samples.

            The latest report significantly increases the number of H1N1 isolates tested for amantadine resistance. Since all are sensitive, it is likely that the H1N1 in the United States is clade 2B (Brisbane/59) and not clade 2C (Hong Kong), which was 100% amantadine resistant last season in the United States.

            Thus, clade 2B has become the dominant H1N1 sub-clade in the United States, and has also been the dominant influenza A isolate in the United States since 112/128 subtypes influenza A was H1N1. Similarly, clade 2B is the most common influenza in the United States at this time since 282/365 isolates are influenza A.

            The resistance levels in H1N1 in the United States is similar to other countries in North America and Europe, where levels are at or near 100% for Canada (1/1), England (19/20), and Scotland (2/2) and at 100% in Norway and Austria.

            At this time H3N2 is the dominant influenza A subtype reported in Europe, but in the United States, the vast majority of influenza A is H1N1, raising concerns regarding the current antiviral recommendations for seasonal flu, which includes oseltamivir.


            .
            "The next major advancement in the health of American people will be determined by what the individual is willing to do for himself"-- John Knowles, Former President of the Rockefeller Foundation

            Comment


            • Re: Seasonal Flu 2008 - 2009

              Summer flu

              Worst flu in 5 years hits late and hard

              December 06, 2008 11:15pm

              FLU season has hit South Australia late, and it is not yet over, SA Health warns.

              In the past month there have been dozens of cases of the potentially deadly Influenza A strain, and of the less potent Influenza B strain, reported to the department.

              Many more cases go unreported. Two nursing home residents have died and dozens became critically ill after catching Influenza A this year.

              SA Health chief medical officer Professor Paddy Phillips said the hope now was for a steady decline in the number of flu cases.

              "Unfortunately influenza is around all year, so it's never too late to have a flu vaccination," he said. "(Without the vaccination) we would have expected more cases, and more problems with the influenza."

              SA Health figures show there have been 449 cases reported so far this year.

              That rate is the highest in five years, but Professor Phillips said it was difficult to compare figures because flu was made a notifiable disease this year.

              Whooping cough (or pertussis) is also high, with about twice as many cases as last year.

              Professor Phillips said whooping cough tended to go in cycles every three to four years.

              "We've had more than usual this year," he said.

              "Again, it's vaccine-preventable. If you're not vaccinated you can really get sick."

              Shigella, a highly infectious stomach bug, is at the highest rate it's been in five years. National figures also show SA has a shingles rate twice the national average.

              Professor Phillips said every year some things went up while others went down.

              Dillon Francis, 31, of Houghton, is still recovering from a bout of the flu.

              He said that as a bartender he has heard from numerous people in the past few weeks who have been battling colds and the flu. "I've had the flu before and it's terrible,"
              he said.

              "(This time) it started with aches and pains, and I was freezing cold, even under the blankets with a tracksuit and the electric blanket on. I've got a fairly good immune system so it only lasted about four days. "I ended up getting antibiotics because I developed tonsillitis as well."

              ?Addressing chronic disease is an issue of human rights ? that must be our call to arms"
              Richard Horton, Editor-in-Chief The Lancet

              ~~~~ Twitter:@GertvanderHoek ~~~ GertvanderHoek@gmail.com ~~~

              Comment


              • Re: Seasonal Flu 2008 - 2009

                Commentary

                Comment


                • Re: Seasonal Flu 2008 - 2009

                  Commentary

                  Mismatched Flu Antiviral Recommendations in the United States
                  Recombinomics Commentary 12:41
                  December 8, 2008

                  Limited data on antiviral resistance, as well as the uncertainty regarding which influenza virus types or subtypes will circulate during the season, make it impossible to provide an indication of the prevalence of influenza viruses resistance to oseltamivir or the adamantanes (amantadine and rimantadine) nationally or regionally at this time. CDC has solicited a representative sample of viruses from WHO collaborating laboratories in the United States, and more specimens are expected as influenza activity increases.

                  Based on the level of oseltamivir resistance observed in only one influenza subtype, H1N1, and the persisting high levels of resistance to the adamantanes in H3N2 viruses, CDC continues to recommend the use of oseltamivir and zanamivir for the treatment or prevention of influenza in the United States.

                  The above comments are from recent CDC weekly reports on influenza. The statement on uncertainty is from the latest (week 48) update, while the statement on antiviral recommendations was in the week 46 report.

                  However, the antiviral situation in the United States is quite straight forward, and unlikely to change with additional near term data. Resistance to the adamantines is at or near 100&#37; for H3N2, while resistance to oseltamivir (Tamiflu) is at or near 100% for H1N1. Since the vast majority of influenza A in the United States is H1N1 at this time, the current recommendations discourage use of adamantines, when most influenza A is sensitive, and encourage oseltamivir, when most influenza A is resistant, creating a significant mismatch in antiviral recommendations for the United States.

                  The basis for a prediction of near term stasis is based on results for this season for North America and Europe, where oseltamivir resistance is approximately 100% for H1N1 and adamantine resistance is approximately 100% for H3N2. Although resistance levels in H3N2 has been largely unchanged in recent seasons, the level of oseltamivir resistance (H274Y) has evolved significantly over the past few seasons, but the levels of 100% began to appear in the 2008 season in the southern hemisphere, and now is confirmed in the northern hemisphere for this season.

                  Initially, H274Y appeared on a number of H1N1 genetic backgrounds in patients not receiving oseltamivir. H274Y was reported in clade 2C (Hong Kong) in the 2005/2006 season in China. It then appeared in clade 1 (New Caledonia) in the United States and England in 2006/2007. Last season it was in clade 2B in the United States and England, but did not initially dominate. A second change, D3548G, which had been in clade 2C and clade 2A (Solomon Island) previously, was acquired by clade 2B via recombination, and this sub-clade, which both H274Y and D354G began to dominate.

                  In south countries in Europe (Norway, France, Russia) and North America (Canada) levels increased to more than 40% of H1N1 isolates. In the United States the level was closer to 10% because clade 2B and 2C were co-circulating and there was no reported H274Y in clade 2C in the United States. Moreover, most of clade 2B also did not have H274Y.

                  However, the following flu season in the summer hemisphere, the sub-clade with H274Y and D354G seed the season, and resistance levels rose to 100%, raising concerns that the new 2008/2009 season in the northern hemisphere would also be seeded by the same sub-clade and resistance would also increase to 100%. H1N1 resistance testing Europe and North America have confirmed the increase to 100%.

                  In the United States this season H274Y levels rose to close to 100% in clade 2B, and initial testing failed to identify clade 2C (which was at 100% adamantine resistance in the US last season). Thus, the levels of antiviral resistance in influenza A are related to the relative levels of H1N1 and H3N2, and at this time H1N1 levels are widespread and account for 80% or more of influenza A isolates in multiple regions.

                  As a result, the current antiviral recommendations in the United States are mismatched with the levels in co-circulation. The vast majority of influenza A is H1N1 which is oseltamivir resistance and adamantine sensitive, yet use of adamantines are discouraged and oseltamivir is encouraged in current CDC recommendations.


                  .
                  "The next major advancement in the health of American people will be determined by what the individual is willing to do for himself"-- John Knowles, Former President of the Rockefeller Foundation

                  Comment


                  • Re: Seasonal Flu 2008 - 2009

                    HPA Weekly National Influenza Report
                    Summary of UK* surveillance of influenza and other seasonal respiratory illness


                    10 December 2008 (Week 50
                    )

                    Summary
                    Clinical indices of acute respiratory illness (England, Wales, Scotland and Northern Ireland)
                    The overall influenza-like illness incidence rate**
                    remained below the baseline activity threshold (30 per
                    100, 000) at 16.5 per 100,000 in week 48/08 and nearly
                    doubled to 27.6 per 100,000 in week 49/08 (Figure 1).
                    The rate in the northern region increased from 8.1 per
                    100,000 in week 48/08 to 15.1 per 100,000 in week 49/
                    *Incorporating data from the Royal College of General Practitioners (RCGP) (England and Wales), The National
                    Public Health Service for Wales (NPHS), Health Protection Scotland (HPS), Communicable Disease Surveillance
                    Centre Northern Ireland (CDSC Northern Ireland), the Office for National Statistics (ONS) (England and Wales),
                    Medical Officers of Schools Association (MOSA) (England) and NHS Direct (England and Wales).
                    Figure 1


                    : RCGP consultation rate for influenza – like illness, 2008/09 and recent years, England and Wales
                    During weeks 48/08 and 49/08, influenza activity across the UK appeared to be increasing. GP consultation rates
                    have increased sharply but remain within baseline levels in England, they have also increased slightly and remain
                    within baseline in Scotland and Wales. In Northern Ireland the rate has greatly increased but thresholds have not yet
                    been set. Thresholds for NHS Direct in England and Wales have been exceeded. Of the samples referred to the
                    Centre for Infections’ Respiratory Virus Unit (RVU) during weeks 48/08 and 49/08, 139 were positive for influenza A,
                    eight A (H1) and 131 A (H3) and two for influenza B. Other NHS and HPA laboratories in England and Wales reported
                    97 influenza A and one influenza B positive specimens during these two weeks. Four Scottish and eight Northern Irish
                    influenza A positive specimens were reported in weeks 48 and 49/08. Nine outbreaks of respiratory illness were
                    reported from England and Northern Ireland in week 49/08, several have been confirmed as influenza A and others
                    are still under investigation. The weekly vaccine uptake rates for the over 65 years increased from 69.7&#37; in week 48/
                    08 to 71.4% in week 49/08 and in the under 65 years at risk group it increased from 42.2% to 43.4% in the same time
                    period. Influenza activity was at low levels throughout the rest of Europe with 11 countries reporting increasing activity
                    in week 48/08.
                    As influenza activity is increasing, we will now be publishing full reports weekly.
                    England and Wales
                    Royal College of General Practitioners
                    (


                    http://www.rcgp.org.uk/bru/index.asp)

                    Covered in this report:
                    Data, except that from ONS, MOSA and non-UK sources: 24/11/08 - 07/12/08 (Weeks 48 and 49, 2008 )
                    Data from ONS, MOSA and non-UK sources: 17/11/08 - 30/11/08 (Weeks 47 and 48, 2008)
                    ** RCGP incidence rates in this report only refer to first or new episodes of infection diagnosed by a GP.
                    Neuraminidase inhibitor susceptibility testing on 30 A (H3) isolates since week 36/08 showed that all are sensitive to
                    oseltamivir and zanamivir but resistant to amantadine. All of the four influenza B isolates received since week 36/08
                    are sensitive to oseltamivir and zanamivir


                    . Twenty-three of 24 A (H1) specimens tested in the same time frame are
                    resistant to oseltamivir but sensitive to zanamivir and amantadine. The majority of these resistant viruses come from
                    the south west of England with the remaining from Wales and northern England. Two influenza A (H1) isolates have
                    been found to be resistant to oseltamivir in Scotland this season.
                    Antiviral drug susceptibility test
                    08, an increase from 20.1 per 100,000 to 37.5 per 100,000
                    was seen in the central region and in the south it increased
                    from 17.6 per 100,000 to 25.1 per 100,00 in weeks 48
                    and 49/08 respectively. The rate was highest in the 15-44
                    year age group at 32.1 per 100,000 in week 49/08 (Figure
                    2).
                    The rate for acute bronchitis has been increasing steadily
                    over the season, it increased from 132.7 per 100,000 in
                    week 48/08 to 151.9 per 100,000 in week 49/08.
                    2
                    0
                    2 5
                    5 0
                    7 5
                    1 0 0
                    1 2 5
                    1 5 0
                    4 0 4 2 4 4 4 6 4 8 5 0 5 2 2 4 6 8 1 0 1 2 1 4 1 6 1 8 2 0
                    W e e k
                    Rate per 100 000 population
                    E n g l a n d ( R C G P )
                    S c o t l a n d ( H P S )
                    W a l e s ( N P H S )
                    N o r t h e r n I r e l a n d ( C D S C N I )
                    Figure 3


                    : GP Consultation rates for influenza/influenza-like illness in the U.K
                    QSurveillance
                    HPA and Nottingham University Division of Primary
                    Care.
                    (


                    http://www.qresearch.org)

                    Northern Ireland
                    CDSC Northern Ireland
                    (


                    http://www.cdscni.org.uk/)

                    The combined rate for influenza and influenza-like illness
                    nearly doubled from 42.8 per 100,000 (updated rate) in
                    week 48/08 to 69.2 per 100,000 in week 48/08 (Figure 3).
                    This rate has cosistently been highest in the 15-64 year
                    age group. No threshold has been set for Northern Ireland.
                    This primary care surveillance system uses
                    QSurveillance, a database of general practice derived
                    data. During weeks 48/08 and 49/08, over 3200 practices
                    reported from England, Wales, Scotland and Northern
                    Ireland covering a population of over 22 million. The rate
                    of influenza-like illness increased from 14 per 100,000
                    in week 48/08 to 19 per 100,000 in week 49/08. The
                    highest rates have consistently been in the 15-44 year
                    age group. In both weeks the rates were highest in
                    London, Northern Ireland and the West Midlands.
                    NHS Direct total call activity
                    England and Wales
                    (


                    http://www.nhsdirect.nhs.uk/)

                    Cold/flu and fever calls increased and exceeded the
                    baseline levels from week 48/08 to 49/08. The proportion
                    of cold/flu calls increased from 0.9% in week 48 to 1.2%
                    in week 49/08 (1.2% is the theshold). Fever calls in the 5-
                    14 age group made up 8.1% of the total calls in week 48/
                    08, this increased to 10.0% in week 49/08 which exceeds
                    the threshold of 9%.
                    Wales
                    National Public Health Service
                    (


                    http://www.wales.nhs.uk/sites/home.cfm?OrgID=368)

                    GP consultation rates for influenza increased from 6.9
                    per 100 000 in week 48/08 to 7.8 per 100,000 in week
                    49/08. Both figures are well below the baseline threshold
                    of 25 consultations per 100,000 (Figure 3).
                    Figure 2


                    : RCGP Episode incidence rates for influenza-like illness (ILI) by age group, England and Wales.
                    0
                    1 0
                    2 0
                    3 0
                    4 0
                    5 0
                    6 0
                    7 0
                    8 0
                    9 0
                    1 0 0
                    4 0 4 2 4 4 4 6 4 8 5 0 5 2 2 4 6 8 1 0 1 2 1 4 1 6 1 8 2 0
                    W e e k
                    Rate per 100 000 population
                    0 - 1
                    1 - 4
                    5 - 1 4
                    1 5 - 4 4
                    4 5 - 6 4
                    6 5 - 7 4
                    > 7 5
                    Medical Officers of Schools Association
                    (MOSA)
                    During weeks 47 and 48/08, 21 and 20 schools,
                    respectively, reported data. There were two new episodes
                    of influenza like illness reported in week 47/08 giving a
                    rate of 0.36 per 1000 and 21 new episodes in week 48/
                    08 giving a rate of 3.85 per 1000. The rate of upper
                    respiratory tract infection in week 47/08 was 17.3 per
                    1000 population (97 new episodes) which decreased to
                    7.7 (42 new episodes) in week 48/08.
                    Scotland
                    Health Protection Scotland
                    (


                    http://www.hps.scot.nhs.uk/)

                    GP consultation rates for influenza increased from 19.0
                    per 100,000 in week 48/08 to 20.0 per 100,000 in week
                    49/08. Activity remains below the Scottish baseline
                    threshold of 50 consultations per 100,000 (Figure 3).
                    3
                    Respiratory Virus Unit (RVU) Influenza Reference
                    Laboratory, CfI
                    Fifty-one specimens tested positive for influenza A viruses
                    in week 48/08 and 88 in week 49/08 (Table 1). Since week
                    40/08 129 viruses have been characterised: 14 A/Solomon
                    Islands/3/2006 (H1)-like which is similar to the vaccine
                    strain, two A (H1) Brisbane/59/2007 (H1N1)-like (vaccine
                    strain) and 103 A (H3) A/Brisbane/10/2007 (H3N2)-like
                    (vaccine strain) (Figure 4).


                    The majority of influenza A
                    (H1) specimens received to date come from Southern
                    England (table 1).
                    Neuraminidase inhibitor susceptibility testing on 30 A
                    (H3) isolates since week 36/08 showed that all of them
                    are sensitive

                    to oseltamivir and zanamivir but resistant to
                    amantadine. Of the 24 A (H1) specimens received and
                    tested, 23 are resistant to oseltamivir but sensitive to
                    zanamivir and amantadine. These specimens are from
                    Northern and Southern England and Wales (table 1). Three
                    * RSV detection is by PCR only
                    Other NHS and HPA laboratories (England and
                    Wales)
                    The number of specimens positive for influenza A has
                    increased from 37 in week 48/08 to 60 in week 49/08
                    and the number of RSV positives decreased slightly
                    (from 454 to 437) in the same time period. To date, a
                    higher number of influenza A positive specimens have
                    come from southen England. (Table 2).
                    Please note that these data are provisional.
                    Laboratory indices of acute respiratory illness
                    *


                    Detections of RSV by isolation are not included.
                    Table 1 “Detections” (PCR and isolation) of influenza and
                    RSV made by RVU (CfI) Reference Laboratory.
                    Samples from community and hospital sources,
                    by week of report.
                    3 40 1 1
                    1 78 3 4
                    21 126 1 21
                    1 2 0 0
                    1 2 0 0
                    0 0 0 0
                    27 248 5 26
                    Influenza Detections by
                    PCR and Isolation
                    A (H1) A (H3) B RSV*
                    Cumulative to date
                    Northern England
                    Central England
                    Southern England
                    Wales
                    Scotland
                    Northern Ireland
                    Cumulative Total
                    Influenza type ( subtype)
                    Week 48/08
                    Week 49/08
                    (week 40/08 – 49/08)
                    356 336 3922
                    Table 2 ‘‘Detections” (isolation, PCR, direct
                    immunofluorescence and paired sera tests) of
                    influenza and RSV reported to CfI by NHS and
                    HPA microbiology laboratories. Data for England
                    and Wales by RCGP region, by week of report
                    Week 48/08
                    Week 49/08
                    Cumulative to Date
                    (week 40/08 - 49/08)
                    Northern England
                    Central England
                    Southern England
                    Wales
                    Cumulative Total
                    Detection (isolates, DIF and PCR)
                    Influenza A Influenza B RSV*
                    37 0 454
                    60 1 437
                    38 3 874
                    45 2 306
                    78 2 1029
                    9 0 117
                    170 7 2326
                    3 48 1 7
                    5 83 1 5
                    Figure 4 : Total ( Community and Hospital) Influenza detections (PCR and Isolation) characterised by RVU,CfI, by week of
                    specimen
                    0
                    5
                    1 0
                    1 5
                    2 0
                    2 5
                    3 0
                    3 5
                    4 0
                    4 0 4 2 4 4 4 6 4 8 5 0 5 2 2 4 6 8 1 0 1 2 1 4 1 6 1 8 2 0
                    W e e k
                    Number of detections
                    I n f l u e n z a A ( H 1 )
                    I n f l u e n z a A ( H 3 )
                    I n f l u e n z a B
                    further influenza A(H1) isolates are undergoing
                    resistance testing at the moment. Four influenza B
                    isolates have been received and tested and all are
                    sensitive to oseltamivir and zanamivir.
                    Please note that these data are provisional.
                    4
                    Avian Influenza
                    The WHO continues to monitor and report on new cases
                    of human infection with A(H5N1) avian influenza when
                    they occur. A report by WHO on 9 December confirms two
                    further human cases of A(H5N1) avian influenza in
                    Indonesia, of which one has died. According to WHO,
                    the total number of confirmed human infections
                    worldwide with H5N1, since December 2003, is 389 of
                    which 246 (63%) have died.
                    Useful links:
                    Situation updates from WHO (human):
                    http://www.who.int/csr/disease/avian_influenza/en/
                    Situation summary from the HPA (avian and human):
                    http://www.hpa.org.uk/infections/top...ion_update.htm
                    Virological data from Northern Ireland
                    (


                    http://www.cdscni.org.uk/)

                    Eight influenza A positive samples were reported in
                    weeks 48/08 and 49/08, two sentinel and six nonsentinel.
                    In week 48/08 30 non-sentinel samples
                    were positive for RSV and in week 49/08 this number
                    was 37.
                    Flu Vaccination Campaign 2008/09 (England)
                    Data on influenza vaccination uptake is taken weekly from
                    a sample of GPs in England.
                    Steady increasing trends have been seen since since
                    the start of the campaign in September 2008. The
                    proportion vaccinated in the over 65 year age group
                    increased from 69.7% in week 48/08 to 71.4% in week
                    49/08. In the under 65 years at risk group, the proportion
                    vaccinated increased from 42.2% in week 48/08 to 43.4%
                    in week 49/08.
                    It should be noted that all data is provisional.
                    In week 48/08 this parallel GP sentinel scheme
                    reported 12 out of 49 (24.5%) influenza A positive
                    specimens, in week 49/08 five of 11 (45.5%)
                    specimens were positive for influenza A and one for
                    influenza B. Two specimens were positive for RSV
                    and five for other respiratory viruses in the same time
                    period.
                    HPA CfI Virological Surveillance of Influenza
                    (England)
                    Outbreak Reports:
                    Nine respiratory illness outbreaks were reported in week
                    49/08; three in care homes (one confirmed influenza A
                    (H3) in Northern Ireland and two in South East England);
                    four in schools (Yorkshire and the Humber, South West
                    England, South East England and London); one
                    confirmed influenza A (H1) from a hospital ward in North
                    West England and one from an army barracks in South
                    East Enlgand. Most are still under investigation
                    CfI would welcome any reports of influenza outbreak
                    investigations. Please email any reports to
                    respdcsc@hpa.org.uk


                    ).
                    Mortality Data
                    Office for National Statistics
                    (


                    http://www.statistics.gov.uk)
                    The number of deaths registered in England and Wales
                    increased from 9430 in week 47/08 to 9717 in week 48/
                    08. The number of deaths due to all respiratory diseases
                    (as underlying cause) stayed constant at 1251 (13.3%)
                    in week 47/08 and 1252 (12.9%) in week 48/08. The
                    weekly all cause registered deaths are shown in Figure
                    5. No excess deaths were detected in either week.
                    Other Reports (UK)
                    Virological data from Scotland
                    (


                    http://www.show.scot.nhs.uk/scieh/)

                    During weeks 48/08 and 49/08, four (7.3%) out of 55
                    sentinel samples, were positive for influenza A and six
                    for RSV. Eighty-one routine samples reported from
                    hospital and community sources were also tested; 14
                    (17.3%) were positive for influenza A and 68 positive for
                    RSV. Two influenza A (H1) isolates from Scotland this
                    season have been found to be resistant to oseltamivir.
                    Virological data from Wales
                    (http://www.wales.nhs.uk/


                    )

                    To date this season one of 25 sentinel samples (week
                    45/08) and nine non-sentinel samples have been
                    positive for influenza A. In week 48/08 eight sentinel
                    samples were tested; none were positive for influenza
                    and one was positive for another respiratory virus.
                    Figure 5 : Weekly all cause registered deaths in England and Wales
                    0
                    2 0 0 0
                    4 0 0 0
                    6 0 0 0
                    8 0 0 0
                    1 0 0 0 0
                    1 2 0 0 0
                    1 4 0 0 0
                    1 6 0 0 0
                    4 0 4 2 4 4 4 6 4 8 5 0 5 2 2 4 6 8 1 0 1 2 1 4 1 6 1 8 2 0
                    W e e k N u m b e r
                    Number of Deaths
                    O b s e r v e d
                    E x p e c t e d
                    9 5 % U p p e r L i m i t
                    Data Source: The National Influenza Vaccine Uptake
                    Monitoring Programme (HPA/DH)
                    5
                    Data for this report were collated by the Influenza/
                    Respiratory Virus Team:
                    Estelle McLean, Joy Field and Richard Pebody
                    Respiratory and Systemic Infections Department
                    HPA Centre for Infections, 61 Colindale Avenue
                    London NW9 5EQ, United Kingdom
                    Tel: (0)20 8327 7768; Fax: (0)20 8200 7868
                    E-mail:


                    respcdsc@hpa.org.uk
                    Maria Zambon, Joanna Ellis, Angie Lackenby, Alison
                    Bermingham and Praveen Sebastianpillai
                    Respiratory Virus Unit, Virus Reference Department
                    HPA Centre for Infections, 61 Colindale Avenue
                    London NW9 5HT, United Kingdom
                    Tel: (0)20 8327 6239; Fax: (0)20 8205 8195
                    E-mail:


                    ernvl@hpa.org.uk
                    If you wish to be included on our email notification list
                    please send your address to:


                    respcdsc@hpa.org.uk
                    Acknowledgements
                    Canada
                    Public Health Agency of Canada
                    (


                    http://www.phac-aspc.gc.ca/fluwatch/index.html)

                    During week 48/08, influenza activity remained low with
                    the majority of the influenza surveillance regions reporting
                    no activity and 13 regions reporting sporadic influenza
                    activity in week 48/08. An increase in the consultation
                    rates and number of viruses detected has been reported.
                    Eighteen of 1818 (1.0%) specimens tested positive for
                    influenza in week 48/08.
                    Since 1 September 2008, six influenza viruses have been
                    characterised: one influenza A/Brisbane/59/2007(H1N1)-
                    like, two A/Brisbane/10/2007 (H3N2)-like, two influenza
                    B/Florida/4/2006-like and one B/Malaysia/2506/2004-like.
                    The influenza A (H1N1) isolate has been found to be
                    resistant to oseltamivir.
                    Ireland
                    Health Protection Surveillance Centre (HPSC)
                    (


                    http://www.hpsc.ie/)

                    In week 48/08 the Irish ILI consultation rate was
                    10.9 per 100,000 and increased sharply to 20.3 per
                    100,000 in week 49/08 (39 consultations).
                    In week 48/08 one of four (25%) sentinel specimens
                    tested positive for influenza A and 40 of 106 nonsentinel
                    specimens tested were positive for RSV. In
                    week 49/08 six of 12 (50%) sentinel samples were
                    positive for influenza; five A and one B. Thirty of 97
                    non-sentinel samples were positive for RSV in week
                    49/08.
                    Two viruses have been characterised as A/Brisbane/
                    10/2007 (H3N2)-like.
                    Other country reports can be obtained from the World
                    Health Organisation:
                    http://www.who.int/csr/disease/influenza/en/
                    Europe
                    European Influenza Surveillance System (EISS)
                    (


                    www.eiss.org)

                    In weeks 47 and 48/08, low levels of seasonal influenza
                    activity were seen across all 26 European countries
                    participating in the EISS. In week 48/08 sporadic activity
                    was reported in eleven countries and increasing activity
                    was reported in England, Estonia, Hungary, Latvia,
                    Lithuania, Poland, Portugal, Serbia, Slovakia, Spain, and
                    Sweden.
                    Out of the total 536 respiratory specimens collected by
                    sentinel physicians during week 48/08, 65 (12.1%)
                    specimens tested positive for influenza, 12 type A (not
                    subtyped), 49 A (H3), two A (H1) and two type B. In addition,
                    72 non-sentinel specimens tested positive including 47
                    influenza A (not subtyped), 20 A (H3), one A (H1), and four
                    type B. These positive specimens were reported from 11
                    countries.
                    Since week 40/08, 79 viruses have been characterised;
                    76 of these seem to be a good match to the strains
                    recommended for the 2008-09 vaccine, the remaining
                    three were B/Malaysia/2506/2004-like.
                    Influenza activity outside the UK
                    In week 48/08 WHO and NREVSS laboratories reported
                    2136 specimens tested for influenza viruses, 43 (2.0%)
                    of which were positive: four influenza A (H1), two A (H3),
                    26 A (not subtyped).
                    Since week 40/08 30 influenza viruses have been
                    characterised; 20 A/Brisbane/59/2007 (H1N1)-like, 3 A/
                    Brisbane/10/2007 (H3N2)-like, four B/Florida/04/2006-
                    like, which are the components recommended for the
                    2008-09 vaccine, and three from the B/Victoria lineage.
                    Of the 25 influenza A (H1) viruses tested this season, 24

                    have been found to be resistant to oseltamivir.

                    http://www.hpa.org.uk/webc/HPAwebFil.../1228894718273

                    Comment


                    • Re: Seasonal Flu 2008 - 2009

                      Of the 24 A (H1) specimens received and
                      tested, 23 are resistant to oseltamivir but sensitive to
                      zanamivir and amantadine. These specimens are from
                      Northern and Southern England and Wales

                      Comment


                      • Re: Seasonal Flu 2008 - 2009

                        Commentary at

                        Comment


                        • Re: Seasonal Flu 2008 - 2009

                          Originally posted by niman View Post
                          Commentary

                          H1N1 Tamiflu Resistance in UK Increases to 96&#37;
                          Recombinomics Commentary 23:45
                          December 10, 2008

                          Of the 24 A (H1) specimens received and tested, 23 are resistant to oseltamivir but sensitive to zanamivir and amantadine. These specimens are from Northern and Southern England and Wales.

                          The above comments are from the week 47/48 report from England and indicate that four more H1N1 isolates have been tested for H274Y, and all four are positive. Thus, the UK levels for H1N1 from England, Wales, and Scotland are above 96% (25/26). In addition, all H1N1 isolates from Norway and Austria have H274Y, indicating H274Y is fixed in H1N1 (clade 2B) in Europe.

                          Similar results have been obtained for North America. The one H1N1 sample from Canada has H274Y, as do 24/25 isolates in the United States, indicating H274Y is also fixed in North America.

                          This fixing has a smaller impact in Europe, because most of the influenza A reported this season in EISS has been H3N2, although H1N1 is dominant in Russia. In contrast, 85-90% of the influenza A in the United States has been H1N1, which creates a mismatch on antiviral recommendations. Amantadine resistance is fixed in H3N2 and use has been discouraged, although H3N2 represents only 10-15% of influenza A. In contrast, oseltamivir (Tamivir) is recommended, even though the vast majority of influenza A is resistant, since H274Y is fixed in H1N1.

                          The CDC has requested additional samples, but the fixing of S31N in H3N2 and H274Y in H1N1 is unlikely to change in the near term, and until frequencies of H3N2 increase significantly, the antiviral recommendations in the United States will remain mismatched with the influenza A in circulation.


                          .
                          "The next major advancement in the health of American people will be determined by what the individual is willing to do for himself"-- John Knowles, Former President of the Rockefeller Foundation

                          Comment


                          • Re: Seasonal Flu 2008 - 2009

                            USA: Update: Influenza Activity ? United States, September 28?November 29, 2008 [US CDC MMWR]

                            Update: Influenza Activity ? United States, September 28?November 29, 2008

                            [From Morbidity and Mortality Weekly Report (MMWR), LINK]


                            During September 28?November 29, 2008, influenza activity remained low in the United States. Of the few influenza viruses characterized thus far this season, most are antigenically related to the strains included in the 2008?09 influenza vaccine. Oseltamivir-resistant influenza A (H1N1) viruses have been detected, but currently available data are insufficient to predict their prevalence for the 2008?09 season. This report summarizes U.S. influenza activity* since the last update (1) and reviews new influenza vaccine recommendations for the current season.

                            Viral Surveillance
                            During September 28?November 29, 2008, approximately 150 World Health Organization (WHO) and National Respiratory and Enteric Virus Surveillance System collaborating laboratories in the United States tested 24,657 respiratory specimens for influenza viruses; 365 (1.5%) were positive (Figure 1).

                            Of these, 282 (77.3%) were influenza A viruses, and 83 (22.7%) were influenza B viruses. One hundred twenty-eight (45.4%) of the 282 influenza A viruses were subtyped; 112 (87.5%) of these were influenza A (H1) viruses, and 16 (12.5%) were influenza A (H3) viruses.

                            Influenza-positive tests have been reported from 26 states in eight of the nine surveillance regions since September 28.

                            Antigenic Characterization
                            WHO collaborating laboratories in the United States are requested to submit a subset of their influenza-positive respiratory specimens to CDC for further antigenic characterization. CDC has antigenically characterized 30 influenza viruses collected by U.S. laboratories during the 2008?09 season, including 20 influenza A (H1N1), three influenza A (H3N2), and seven influenza B viruses. Twenty-seven of the 30 viruses were antigenically related to the components included in the 2008?09 influenza vaccine (A/Brisbane/59/2007-like (H1N1), A/Brisbane/10/2007-like (H3N2), and B/Florida/04/2006-like). The other three influenza B viruses belong to the B/Victoria/02/87 lineage.

                            Antiviral Resistance of Influenza Virus Isolates
                            With limited influenza activity in the United States, few viruses have been available for antiviral resistance testing. Since September 28, 2008, 39 influenza viruses from 11 states have been tested for antiviral resistance; of the viruses tested, 28 (71.8%) were collected from only two states.

                            Preliminary data show that 24 of the 25 influenza A (H1N1) isolates tested were resistant to oseltamivir; all H1N1 isolates were sensitive to zanamivir.
                            All five influenza A (H3N2) and the nine influenza B isolates tested were sensitive to oseltamivir and zanamivir.

                            Twenty-five influenza A (H1N1) isolates and five influenza A (H3N2) isolates were tested for adamantane resistance. All influenza A (H1N1) isolates were sensitive to adamantanes, and all influenza A (H3N2) isolates tested were resistant to adamantanes. The adamantanes are not effective against influenza B viruses.

                            Currently, data on antiviral resistance, and information on which influenza virus types or subtypes will circulate, are insufficient to provide an indication of the prevalence of antiviral resistance at a national or regional level during this season. CDC has solicited a representative sample of viruses from WHO collaborating laboratories in the United States for resistance testing throughout the season, and more specimens are expected as influenza activity increases.

                            Novel Influenza A Viruses
                            One case of human infection with a novel influenza A virus was reported from Texas during the week ending November 15, 2008. A child aged 14 years was infected with swine influenza A (H1N1) in October 2008 after several reported swine exposures. The child recovered from the illness, and no contacts of the child were reported to be ill.

                            State-Specific Activity Levels
                            For the week ending November 29, 2008, influenza activity? was reported as sporadic in Puerto Rico and 22 states, and one state (Hawaii) reported local activity. Twenty-seven states and the District of Columbia reported no activity. No states have reported regional or widespread activity this season.

                            Outpatient Illness Surveillance
                            Since September 28, 2008, the weekly percentage of outpatient visits for influenza-like illness (ILI)? reported by approximately 1,500 U.S. sentinel providers in 50 states, New York City, Chicago, and the District of Columbia that comprise the U.S. Outpatient ILI Surveillance Network (ILINet), has ranged from 0.9% to 1.3% (Figure 2). This is below the national baseline of 2.4%. In addition, all nine surveillance regions reported percentages below their respective region-specific baselines.?

                            Pneumonia- and Influenza-Related Mortality
                            For the week ending November 29, 2008, pneumonia and influenza (P&I) was reported as an underlying or contributing cause of death for 6.7% of all deaths reported to the 122 Cities Mortality Reporting System. This is below the epidemic threshold of 7.1% for that period. Since September 28, 2008, the weekly percentage of deaths attributed to P&I ranged from 6.0%?6.7%, remaining below the epidemic threshold.**

                            Influenza-Associated Pediatric Hospitalizations
                            Pediatric hospitalizations associated with laboratory-confirmed influenza infections are monitored by two population-based surveillance networks, the Emerging Infections Program (EIP) and the New Vaccine Surveillance Network (NVSN). No influenza-associated pediatric hospitalizations have yet been reported by either network this season.

                            Influenza-Related Pediatric Mortality
                            No influenza-related pediatric deaths have been reported for the 2008?09 season.

                            Reported by:
                            WHO Collaborating Center for Surveillance, Epidemiology, and Control of Influenza. L Brammer, MPH, S Epperson, MPH, L Blanton, MPH, R Dhara, MPH, T Wallis, MS, L Finelli, DrPH, A Fiore, MD, L Gubavera, PhD, J Bresee, MD, A Klimov, PhD, N Cox, PhD, Influenza Div, National Center for Immunization and Respiratory Diseases; S Doshi, MD, EIS Officer, CDC.

                            FIGURE 1. Number* and percentage of respiratory specimens testing positive for influenza reported to CDC by U.S. World Health Organization/National Respiratory and Enteric Virus Surveillance System collaborating laboratories, by week ? United States, 2008?09 influenza season


                            <table style="width: auto;"><tbody><tr><td></td></tr><tr><td style="font-family: arial,sans-serif; font-size: 11px; text-align: right;">From TABLES</td></tr></tbody></table>

                            Editorial Note:
                            During September 28?November 29, 2008, the United States experienced a low level of influenza activity which is typical for this time of year and similar to the past four influenza seasons. The peak of influenza activity has come before January in only five of the past 20 seasons; February or March has been the peak month in 11 of those 20 seasons (CDC, unpublished data, 2008).

                            Influenza vaccine first became available in August, allowing persons to be vaccinated before influenza activity began. Vaccination efforts should continue during December given the most common timing of peak influenza activity, and providers should offer influenza vaccine throughout the influenza season (which can persist as late as April or May) to protect as many persons from influenza infection and its complications as possible.

                            Most of the U.S. influenza viruses identified and characterized thus far in the 2008?09 season are antigenically similar to the components included in the 2008?09 influenza vaccine. However, these viruses were isolated in few states and early in the influenza season; CDC will test more viruses as flu activity increases and more samples become available. The season has not progressed enough to determine which influenza virus type or subtype will predominate this season.

                            On average, influenza is estimated to cause approximately 226,000 hospitalizations and 36,000 deaths per year in the United States. Annual vaccination remains the best method for preventing influenza and its potentially severe complications. The Advisory Committee on Immunization Practices (ACIP) recently expanded its recommendations for influenza vaccination to include all children aged 6 months?18 years. In addition, influenza vaccine should be administered to other persons at high risk for influenza-related complications, close contacts of those at high risk (including health-care workers), and anyone else who wants to decrease their risk for influenza (2).

                            CDC conducts surveillance for resistance of circulating influenza viruses to licensed antiviral medications: adamantanes (amantadine and rimantadine) and neuraminidase inhibitors (zanamivir and oseltamivir).

                            Antiviral resistance testing is not commercially available to guide clinical management of individual patients.

                            Influenza A (H1N1) viruses that have a genetic mutation conferring oseltamivir resistance appeared and circulated during the 2007?08 Northern Hemisphere influenza season (3), and during the 2008 Southern Hemisphere season, with some Southern Hemisphere countries reporting that a majority of tested A (H1N1) viruses were resistant to oseltamivir (4).

                            To date, oseltamivir-resistant A (H1N1) viruses from all countries that have submitted specimens to CDC have been sensitive to zanamivir, and most have been susceptible to the adamantanes.

                            All tested influenza A (H1N1), influenza A (H3N2), and influenza B viruses have been sensitive to zanamivir.

                            Most recent influenza A (H3N2) viruses circulating worldwide are resistant to adamantanes, and adamantanes are not effective against influenza B infections.

                            The prevalence of oseltamivir resistance this season will depend on the level of influenza activity, the proportion of resistance among influenza A (H1N1) viruses and the proportion of A (H1N1) viruses among all circulating influenza viruses.

                            At this time, too few specimens from a limited geographic area have been tested to accurately estimate either proportion; thus the prevalence of oseltamivir resistance for the 2008?09 season cannot be estimated accurately.

                            Enhanced surveillance for oseltamivir-resistant viruses is ongoing at CDC. Alternatives for antiviral treatment in the context of widely circulating oseltamivir-resistant viruses have been suggested.

                            These treatment options, which might include preferential use of zanamivir or therapy with a combination of antivirals for certain patients, have been outlined in the ACIP 2008 influenza recommendations.??

                            Currently, the neuraminidase inhibitors oseltamivir and zanamivir remain the recommended medications for treatment and chemoprophylaxis of influenza.

                            Clinicians should remain alert for changes in recommendations that might occur as the 2008?09 influenza season progresses. Recommendations regarding the use of antiviral medications might be revised if surveillance data indicate a substantial and widespread increase in the prevalence of oseltamivir-resistant influenza viruses in the United States.

                            FIGURE 2. Percentage of visits for influenza-like illness (ILI) reported by the U.S. Outpatient Influenza-like Illness Surveillance Network (ILINet), by week ? United States, September 28?November 29, 2008 and 2006?07 and 2007?08 influenza seasons

                            <table style="width: auto;"><tbody><tr><td></td></tr><tr><td style="font-family: arial,sans-serif; font-size: 11px; text-align: right;">From TABLES</td></tr></tbody></table>
                            Vaccination remains the cornerstone of influenza prevention efforts. Influenza vaccination can prevent influenza infections from strains that are sensitive or resistant to antiviral medications; the influenza A (H1N1) viruses found to be oseltamivir resistant are antigenically similar to the components included in the 2008?09 vaccine. December 8?14 is National Influenza Vaccination Week. Health-care providers are encouraged to take advantage of heightened awareness of the benefits of influenza vaccination and to increase vaccination efforts during this week to reach persons who have not yet been vaccinated.

                            CDC continues to conduct surveillance to provide up-to-date recommendations regarding prevention and treatment of influenza. Influenza surveillance reports for the United States are posted online weekly during October?May and are available at http://www.cdc.gov/flu/weekly/fluactivity.htm. Additional information regarding influenza viruses, influenza surveillance, influenza vaccine, and avian influenza is available at http://www.cdc.gov/flu.

                            Acknowledgments
                            This report is based, in part, on data contributed by participating state and territorial health departments and state public health laboratories, WHO collaborating laboratories, National Respiratory and Enteric Virus Surveillance System collaborating laboratories, the U.S. Influenza Sentinel Provider Surveillance System, and the 122 Cities Mortality Reporting System; WHO National Influenza Centers, WHO Global Influenza Programme, Geneva, Switzerland; A Kelso, PhD, I Barr, PhD, WHO Collaborating Center for Reference and Research on Influenza, Parkville, Australia; A Hay, PhD, WHO Collaborating Center for Reference and Research on Influenza, National Institute of Medical Research, London, England; and M Tashiro, MD, WHO Collaborating Center for Reference and Research on Influenza, National Institute of Infectious Diseases, Tokyo, Japan.

                            References
                            1. CDC. Influenza activity?United States and worldwide, May 18?September 19, 2008. MMWR 2008;57:1046?9.
                            2. CDC. Prevention and control of influenza: recommendations of the Advisory Committee on Immunization Practices (ACIP), 2008. MMWR 2008;57(No. RR-7).
                            3. CDC. Influenza activity?United States and worldwide, 2007?08 season. MMWR 2008;57:692?7.
                            4. World Health Organization. Influenza A(H1N1) virus resistance to oseltamivir?2008 influenza season, southern hemisphere. Geneva, Switzerland: World Health Organization; 2008. Available at http://www.who.int/csr/disease/influ...1200801013.pdf.

                            * The 2006?07 and 2007?08 seasons reported 52 weeks; therefore, the week 53 data point for those seasons is an average of weeks 52 and 1.
                            ?? Available at http://www.cdc.gov/flu/professionals...resistance.htm.

                            ? Defined as a temperature of >100.0?F (>37.8?C), oral or equivalent, and cough and/or sore throat, in the absence of a known cause other than influenza.
                            ? The national and regional baselines are the mean percentage of visits for ILI during noninfluenza weeks for the previous three seasons plus two standard deviations. A noninfluenza week is a week during which <10% of specimens tested positive for influenza. National and regional percentages of patient visits for ILI are weighted on the basis of state population. Use of the national baseline for regional data is not appropriate.
                            ** The seasonal baseline proportion of P&I deaths is projected using a robust regression procedure in which a periodic regression model is applied to the observed percentage of deaths from P&I that were reported by the 122 Cities Mortality Reporting System during the preceding 5 years. The epidemic threshold is 1.645 standard deviations above the seasonal baseline.

                            * The CDC influenza surveillance system collects five categories of information from 10 data sources. Viral surveillance: U.S. World Health Organization collaborating laboratories, the National Respiratory and Enteric Virus Surveillance System, and novel influenza A virus case reporting. Outpatient illness surveillance: U.S. Influenza Sentinel Provider Surveillance Network and the U.S. Department of Veterans Affairs/U.S. Department of Defense BioSense Outpatient Surveillance System. Mortality: 122 Cities Mortality Reporting System and influenza-associated pediatric mortality reports. Hospitalizations: Emerging Infections Program and New Vaccine Surveillance Network. Summary of geographic spread of influenza: state and territorial epidemiologist reports.
                            ? Levels of activity are 1) no activity; 2) sporadic: isolated laboratory-confirmed influenza cases or a laboratory-confirmed outbreak in one institution, with no increase in activity; 3) local: increased ILI, or at least two institutional outbreaks (ILI or laboratory-confirmed influenza) in one region with recent laboratory evidence of influenza in that region; virus activity no greater than sporadic in other regions; 4) regional: increased ILI activity or institutional outbreaks (ILI or laboratory-confirmed influenza) in at least two but less than half of the regions in the state with recent laboratory evidence of influenza in those regions; and 5) widespread: increased ILI activity or institutional outbreaks (ILI or laboratory-confirmed influenza) in at least half the regions in the state with recent laboratory evidence of influenza in the state.
                            -
                            -----

                            Comment


                            • Re: Seasonal Flu 2008 - 2009

                              Tomorrow's MMWR data matches last week's CDC report.

                              Data and antiviral recommendations are VERY old.

                              Comment


                              • Re: Seasonal Flu 2008 - 2009

                                ITALY: SEASONAL INFLUENZA VIROLOGICAL SURVEILLANCE, WEEKLY UPDATE (12/11/2008) [MINISTRY OF HEALTH]

                                VIROLOGICAL SURVEILLANCE FOR INFLUENZA

                                December 10, 2008

                                Update, Week: 49/08

                                [Manual translation by IOH]

                                Original PDF Document: LINK


                                ITALY


                                Of 37 samples collected during the 49th week, only one type A influenza virus has been isolated: a subytpe A/H3N2, by Parma's University.

                                An additional influenza A virus has been isolated by Florence University last week, and subtyped as A/H3N2.
                                Table below reports cumulative virological data collected during this first surveillance month:

                                [TYPE / WEEK: 46 / 47 / 48 / 49 / TOTAL]
                                FLU A / 3 / 4 / 4 / 1 / 12
                                A (unsubtyped) ... / ... / ... / ... / ...
                                A/H3N2 / 3 / 4 / 4 / 1 / 12
                                A/H1N1 / ... / ... / ... / ... / ...
                                FLU B / 0 / 0 / 0 / 0 / ...
                                TOT SAMPLES POSITIVE / 3 / 4 / 4 / 1 / 12

                                N.B. Some variations could happen in respect to previous weekly update, due to further viral characterization done.


                                WORLD'S UPDATE

                                Europe
                                Almost all European countries that have sent data though surveillance network, have detected an increasing circulation of influenza virus, although at low level. 12% of collected samples have resulted influenza positive.

                                92% of positive samples were influenza type A, mostly subtype H3; influenza B and A/H1 was also detected.
                                RSV (respiratory syncitial virus) circulation is increasing.

                                For further information, please do refer to the websites below:


                                USA
                                During current surveillance week, influenza virus circulation has been detected at low level; only 2% of the collected samples resulted influenza virus positive. The vast majority of isolated was influenza A.

                                Further informations at:
                                Everything you need to know about flu viruses and flu illness, including symptoms, treatment and prevention.

                                -
                                -----

                                Comment

                                Working...
                                X