Announcement

Collapse
No announcement yet.

season 2012/3 vs. 1999/0 and 2003/4

Collapse
X
 
  • Filter
  • Time
  • Show
Clear All
new posts

  • season 2012/3 vs. 1999/0 and 2003/4

    google flu trend daily, since 2012-01-27 (google updates at ~14:30 MET)

    Code:
    (max2009,max2012)0127,0128,0129,0130,0131,0201,0202,0203,0204,0205,0206,0207,0208,0209,0210,0211,0212,0213,0214,0215,0219,0220,0221,0222,0223.0224,0225,0226,0227,0228,0301,0302,0307
    -------------------------------------------------------------------------------------------------------------------------------------------------------------------------------
    de:   (1687,1144)1332,1386,1446,1496,1535,1579,1611,1641,1672,1722,1770,1806,1837,1851,1876,1902,1913,1943,1987,2005,2127,2127,2109,2096,2068,2023,1977,1938,1896,1862,1816,1781,1535
    fr:   (0874,0498)0703,0800,0898,0997,1089,1162,1235,1278,1303,1311,1274,1258,1321,1328,1324,1308,1279,1282,1256,1167,1069,1047,1024,0982,0943,0894,0809,0757.0677,0608,0540,0481,0275
    fr,ra:(1379,0727)0929,1025,1142,1233,1356,1419,1561,1641,1699,1783,1796,1766,1931,1877,1834,1728,1627,1587,1522,1315,1146,1112,1079,1067,1004,1002,0882,0798,0683,0610,0533,0477,0273
    ch:   (0262,0204)0598,0634,0665,0688,0722,0725,0718,0719,0711,0690,0682,0672,0670,0681,0687,0695,0702,0702,0703,0696,0628,0610,0586,0561,0552,0537,0516,0507,0486,0462,0447,0417,0311
    nl:   (0199,0096)0233,0245,0246,0256,0271,0275,0270,0270,0259,0247,0225,0204,0192,0184,0174,0164,0161,0162,0160,0160,0180,0174,0166,0159,0150,0141,0131,0122,0118,0112,0113,0110,0090
    be:   (0866,0543)0802,0899,1005,1106,1238,1365,1469,1499,1567,1565,1493,1475,1465,1406,1387,1334,1276,1236,1189,1075,1066,1042,0941,0891,0844,0753,0653,0603,0562,0557,0538,0501,0394
    at:   (1524,1540)1598,...,.....,1881,1972,2022,2052,2063,2084,2068,2082,2097,2137,2114,2141,2203,2217,2208,2216,2212,2341,2390,2397,2409,2408,2408,2366,2322,2256,2201,2150,2105,1806
    us:   (7112,2860)9408,9130,8998,8603,8165,7808,7492,7209,6868,6542,6252,6018,5819,5664,5541,5445,5251,5064,4912,4753,4368,4325,4278,4279,4261,4240,4188,4131,4049,3980,3917,3845,3595
    jp:   (1137,2341)3872,4405,5032,5340,5430,5375,5309,5273,5083,4765,4329,3971,3653,3311,3057,2680,2422,2249,2063,1902,1514,1442,1412,1388,1383,1381,1380.1334,1294,1234,1193,1155,0890
    actual google flu trends , daily or weekly updated, here in this first post USA,

    Jan.26: early states are clearly down now, still up in Sacramento


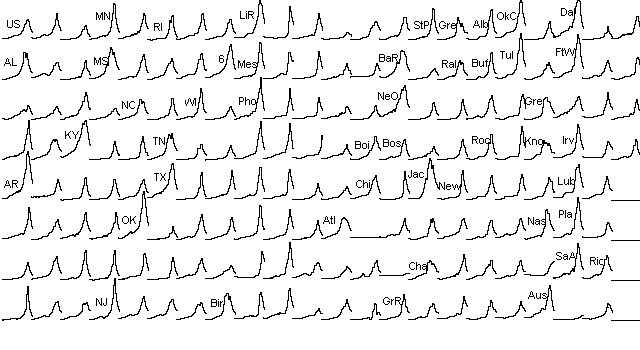
    172 US-weekly charts from GFT, 2013.02.24: location-names see post 10
    latest is West Hollywood, which is still close to the peak in week 9


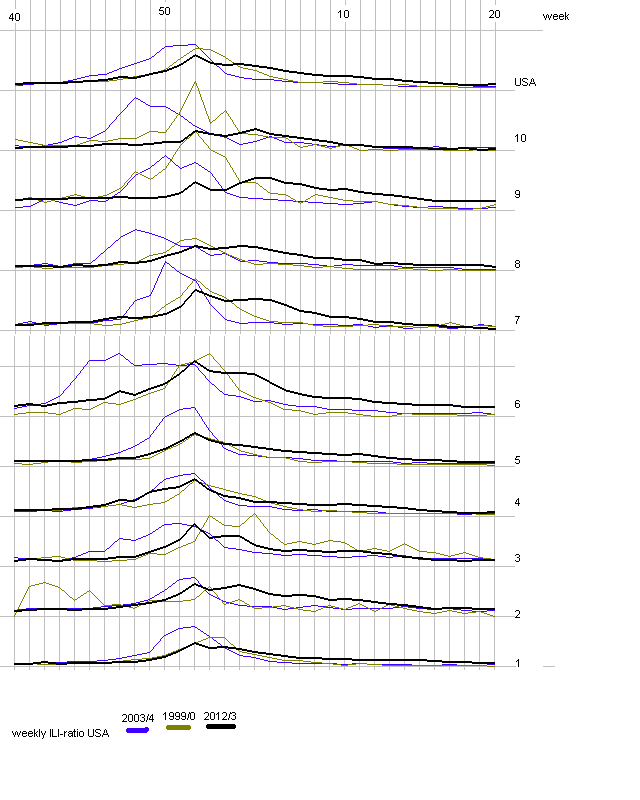
    comparing 1999/0,2003/4,2012/3 , weekly updated (Friday or Saturday)

    --- the peak is not so high in 2012f, but it stays quite long at high level--- (week 5)


    img]http://www.flutrackers.com/forum/attachment.php?attachmentid=16171&stc=1&d=13646180 74[/img]

    http://www.flutrackers.com/forum/attachment.php?attachmentid=16053&stc=1&d=13622222 28[/img]

    img]http://www.flutrackers.com/forum/attachment.php?attachmentid=16008&stc=1&d=13615905 25[/img]


    2003/4 started even earlier than 2012/3 and was probably more severe than 2012/3 will be,
    but 1999/0 could be compared.
    1999/0 was also worse than average and started in week 47 in region 9 (IMO),
    it peaked in week 52 in regions 4,5,7,8,9,10 and in week 1 in regions 1,2,3,6.
    I'd assign the "start", the week where it got considerably steeper than a week wave,to :

    actually in week 51 regions 1,2,3,4,5 are worse than in 1999 while 6,7,8,9,10 are weaker,
    especially 9 (CA,NV,AZ)

    week : regions 1999 - regions 2012
    47:9 - 4,6
    49:8 - 3,5
    50:5,7 - 8,10
    51:1,3,4,10 - 1,2

    img]http://www.flutrackers.com/forum/attachment.php?attachmentid=15562&stc=1&d=13567696 36[/img]

    the 2012 data for region 9 look incorrect, so the national average for 2012, week 51
    should be a bit higher (still not as high as 1999)


    CDC modified the 122 Cities MRS case definition for reporting P&I deaths for the 1999-2000 season.
    Background Death records are a rich source of data, which can be used to assist with public surveillance and/or decision support. However, to use this type of data for such purposes it has to be transformed into a coded format to make it computable. Because the cause of death in the certificates is reported as free text, encoding the data is currently the single largest barrier of using death certificates for surveillance. Therefore, the purpose of this study was to demonstrate the feasibility of using a pipeline, composed of a detection rule and a natural language processor, for the real time encoding of death certificates using the identification of pneumonia and influenza cases as an example and demonstrating that its accuracy is comparable to existing methods. Results A Death Certificates Pipeline (DCP) was developed to automatically code death certificates and identify pneumonia and influenza cases. The pipeline used MetaMap to code death certificates from the Utah Department of Health for the year 2008. The output of MetaMap was then accessed by detection rules which flagged pneumonia and influenza cases based on the Centers of Disease and Control and Prevention (CDC) case definition. The output from the DCP was compared with the current method used by the CDC and with a keyword search. Recall, precision, positive predictive value and F-measure with respect to the CDC method were calculated for the two other methods considered here. The two different techniques compared here with the CDC method showed the following recall/ precision results: DCP: 0.998/0.98 and keyword searching: 0.96/0.96. The F-measure were 0.99 and 0.96 respectively (DCP and keyword searching). Both the keyword and the DCP can run in interactive form with modest computer resources, but DCP showed superior performance. Conclusion The pipeline proposed here for coding death certificates and the detection of cases is feasible and can be extended to other conditions. This method provides an alternative that allows for coding free-text death certificates in real time that may increase its utilization not only in the public health domain but also for biomedical researchers and developers. Trial Registration This study did not involved any clinical trials.


    in weeks 40,...,07 there is more ILI in total now than in 1999f , since it goes down slower

    more than 1999f in USA(all),and regions 8,7,6,5,4,2
    more than in 2003f in regions 2,4,7

    most was region 6 (Texas) fewest in region 1 (Boston)

    Code:
    sum of adjusted ILI-ratios for weeks 40...07 in USA, 3 seasons, 10 regions
    
             1     2     3     4     5     6     7     8     9    10   all
    ------------------------------------------------------------------------
    1999f: 32.7  53.9  66.2  49.0  37.1  67.7  52.9  34.7  95.4  58.3  57.3 
    2003f: 42.1  46.7  66.2  51.5  63.0 108.4  62.4  52.8  67.3  63.0  64.2 
    2012f: 32.5  57.8  55.9  56.5  48.6  94.6  64.0  45.2  66.1  34.8  59.4
    --------------------------------------------------------------
    in total (weeks 40-20) this was more ILI now in 2012f, than in 1999f or 2003f because of the slow decline.

    Code:
     sum of adjusted ILI-ratios for weeks 40...20 in USA, 3 early seasons, 10 regions
    
    region   1     2     3     4     5     6     7     8     9    10   all
    -----------------------------------------------------------------------
    1999f: 36.2  67.7 101.8  57.0  43.1  72.0  62.7  37.6 109.2  61.6  68.6 
    2003f: 46.5  63.6  85.8  59.6  72.3 118.7  71.9  60.1  78.1  70.4  75.1 
    2012f: 47.4  84.8  80.2  74.5  67.7 125.8  82.3  62.0  95.2  44.4  82.0


    Attached Images 99vs12i.gif (10.4 KB, 120 views)
    goo0107.GIF (4.1 KB, 11 views)
    0108.GIF (1.6 KB, 9 views)
    dfu09.gif (4.2 KB, 19 views)
    goo0110.gif (4.3 KB, 25 views)
    goo0111.gif (7.5 KB, 23 views)
    99031201.GIF (16.9 KB, 86 views)
    udf0112.gif (7.7 KB, 17 views)
    172b.gif (8.1 KB, 94 views)
    udf0113.GIF (7.6 KB, 29 views)
    usd0114.gif (8.3 KB, 17 views)
    udf0115.gif (7.8 KB, 14 views)
    du0116.gif (7.8 KB, 7 views)
    udf0117.gif (8.1 KB, 3 views)
    udf0118.GIF (7.8 KB, 5 views)
    99031202.GIF (16.3 KB, 29 views)
    udf0119.gif (8.9 KB, 6 views)
    udf0120.gif (8.1 KB, 5 views)
    130120.GIF (6.9 KB, 17 views)
    99031203.GIF (16.9 KB, 28 views)
    DU0126.GIF (3.4 KB, 3 views)
    172c.gif (9.2 KB, 32 views)
    99031204.gif (16.8 KB, 24 views)
    usgoo05.GIF (9.6 KB, 15 views)
    ---------------------------------------
    23.Feb.2013:
    99vs12i.gif (10.4 KB, 125 views)
    goo0107.GIF (4.1 KB, 12 views)
    0108.GIF (1.6 KB, 10 views)
    dfu09.gif (4.2 KB, 19 views)
    goo0110.gif (4.3 KB, 26 views)
    goo0111.gif (7.5 KB, 23 views)
    172b.gif (8.1 KB, 95 views)
    usd0114.gif (8.3 KB, 17 views)
    du0116.gif (7.8 KB, 8 views)
    130120.GIF (6.9 KB, 19 views)
    DU0126.GIF (3.4 KB, 4 views)
    172c.gif (9.2 KB, 34 views)
    usgoo05.GIF (9.6 KB, 19 views)
    130210.GIF (10.1 KB, 13 views)
    99031206.GIF (17.2 KB, 8 views)
    172d.gif (10.4 KB, 3 views)
    99031207.GIF (17.5 KB, 1 views)
    Attached Files
    Last edited by gsgs; June 20, 2013, 01:54 PM. Reason: update,2013.02.26
    I'm interested in expert panflu damage estimates
    my current links: http://bit.ly/hFI7H ILI-charts: http://bit.ly/CcRgT

  • #2
    Re: season 2012/3 vs. 1999/0

    Region 9: GM(NO ACTIVITY); CA (SPORADIC); HI (SPORADIC); AZ(REGIONAL); NV(WIDESPREAD). CDC: 2 out of 5 elevated, and NORMAL out-patient ILI. CA has yet to see ILI increases above baseline, thereby keeping track below other years. The ILI has been slowing inching upward and CA week 51 not published as of yet. Expect to see higher ILI and percent positive, leading to increased hospitalizations.
    Learn more about the weekly influenza surveillance report (FluView) prepared by the Influenza Division.


    Note that OR (in Region 10) has continued to report LOCAL. Its ILI dropped this week (likely due to holiday). So flu has been slow to take hold on the west coast.
    During the influenza season, the Oregon Public Health Division publishes a weekly surveillance report, Flu Bites. The latest report and archived data are available here, along with other influenza surveillance data.

    Comment


    • #3
      Re: season 2012/3 vs. 1999/0

      google flu trend shows peaks in some states.
      But peak-like structures in almost all states -
      this could be due to the holidays, we saw such
      things in previous years. The next data-point should show it
      Attached Files
      I'm interested in expert panflu damage estimates
      my current links: http://bit.ly/hFI7H ILI-charts: http://bit.ly/CcRgT

      Comment


      • #4
        Re: season 2012/3 vs. 1999/0

        It will be interesting to see if school holiday break made any difference in the spread of flu. Most schools around MO/KS are starting back today or tomorrow.

        Comment


        • #5
          Re: season 2012/3 vs. 1999/0

          Thanks for posting this thread and posting on it. I am very interested to see the outcome of this season.

          Comment


          • #6
            Re: season 2012/3 vs. 1999/0

            update from SC week 51 today looks not so good (3.5%-->6.2%)
            after going down from 3.9% to 3.5% in week 50.

            But then, 6.2% is still "normal" for that region

            ILI weeks 42..04
            -------------------------
            CD,18,20,19,18,22,25,40,31,36,32,68,59,63
            US,13,14,15,16,18,24,23,30,36,46,61,50,--
            R4,12,13,14,18,21,31,30,46,49,55,67,44,--
            B4,18,19,22,25,31,48,45,70,84,93,113,62,--

            TN,06,05,12,18,22,45,33,53,66,68,81,69,--
            AL,19,18,18,20,30,54,53,80,88,90,114,72,70
            GA,10,14,15,20,24,35,30,42,49,50,52,52,--
            SC,04,03,03,04,05,09,20,39,35,62,58,21,19
            MS,44,44,48,47,57,74,74,93,101,130,139,94,--
            NC,04,09,11,15,15,18,22,51,63,48,90,54,38

            FL,16,16,18,18,23,22,20,25,26,28,49,32,28
            IN,12,05,06,05,06,10,09,20,34,40,73,37,41
            KA,10,08,17,11,09,10,12,24,27,33,60,61,45
            TX,28,36,39,44,42,70,52,68,75,101,114,98,--
            LA,26,32,33,37,39,47,48,55,64,78,86,68,--
            NY,08,10,09,07,09,10,18,18,22,30,32,66,43
            CA,24,24,25,25,24,26,24,24,28,37,48,54,--
            IL,15,15,16,17,17,21,19,27,38,45,61,51,--

            (sometimes the data is retrospectively corrected)
            (NC,05,08,10,16,16,19,21,52,70,80,107,--)
            AL,19,18,18,20,30,54,53,84,98,96,127,66
            IN(corrected),05,06,06,09,07,09,13,23,34,52,72,39, 41


            links to US-state reports:

            AL,AK,AZ,AR,CA
            CO,CT,DE,DC,FL,
            GA,HI,ID,IL,IN,
            IA,KA,KY,LA,ME,
            MD,MA,MI,MN,MS,
            MO,MT,NA,NV,NH,
            NJ,NM,NY,NC,ND,
            OH,OK,OR,PA,RI,
            SC,SD,TN,TX,UT,
            VT,VA,WA,WV,WI,
            WY,NYC,VI,

            (CA dead)
            I'm interested in expert panflu damage estimates
            my current links: http://bit.ly/hFI7H ILI-charts: http://bit.ly/CcRgT

            Comment


            • #7
              Re: season 2012/3 vs. 1999/0

              Google flu-trends shows peaks in some states
              but peak-like structures in almost all states,
              this could be due to the holidays, we saw
              that earlier. The next data-point should show it ...


              peaking states one line per day


              Google Flu Trends is updated daily
              Attached Files
              Last edited by gsgs; January 17, 2013, 11:21 PM. Reason: update
              I'm interested in expert panflu damage estimates
              my current links: http://bit.ly/hFI7H ILI-charts: http://bit.ly/CcRgT

              Comment


              • #8
                Re: season 2012/3 vs. 1999/0

                Originally posted by gsgs View Post
                Google flu-trends shows peaks in some states
                but peak-like structures in almost all states,
                this could be due to the holidays, we saw
                that earlier. The next data-point should show it ...


                Google Flu Trends is updated daily

                So it appears a few states have reached a peak and are trending downward?

                I think people in those states can not rely on google trends.as a precise method to measure a flu outbreak. They still need to contact their medical practitioner about a possible flu shot and also they need to be aware of several non-pharmaceutical practices like frequent hand washing, sneeze into the sleeve and social distancing.

                Comment


                • #9
                  Re: season 2012/3 vs. 1999/0

                  in those states it's probably too late for the shot. NY,IL maybe , CA yes.
                  Hopefully it goes goes down in these 4 leaders on Friday ...
                  I remember there were fake peaks earlier, was it 2009
                  I'm interested in expert panflu damage estimates
                  my current links: http://bit.ly/hFI7H ILI-charts: http://bit.ly/CcRgT

                  Comment


                  • #10
                    Re: season 2012/3 vs. 1999/0

                    google flu trend 2012/3 (so far) and 2003/4
                    (1999/0 is not available)


                    Code:
                    
                    Verein Delawa Iowa.. Minnes New Me Rhode  Washin HHS Re Little Beverl San Jo Hialea Smyrna Lexing St Pau Greens Albany Oklaho Provid Dallas Salt L Seattl 
                    igte S re.... ...... ota... xico.. Island gton.. gion 5  Rock, y Hill se, CA h, FL. , GA.. ton, K l, MN. boro,  , NY.. ma Cit ence,  , TX.. ake Ci e, WA. 
                    taaten ...... ...... ...... ...... ...... ......  (IL,   AR... s, CA. ...... ...... ...... Y..... ...... NC.... ...... y, OK. RI.... ...... ty, UT ...... 
                    ...... ...... ...... ...... ...... ...... ...... IN, MI ...... ...... ...... ...... ...... ...... ...... ...... ...... ...... ...... ...... ...... ...... 
                    ...... ....  ..... ...... ...... ...... , MN,  ...... ...... ...... ...... ...... ...... ...... ...... ...... ...... ...... ...... ...... ...... 
                    
                    Alabam Distri Kansas Missis New Yo South  West V HHS Re Mesa,  Fresno Santa  Jackso Honolu Baton  Kansas Raleig Buffal Tulsa, Columb Ft Wor Arling Spokan 
                    a..... ct of  ...... sippi. rk.... Caroli irgini gion 6 AZ.... , CA.. Clara, nville lu, HI Rouge,  City, h, NC. o, NY.  OK... ia, SC th, TX ton, V e, WA. 
                    ...... Columb ...... ...... ...... na.... a.....  (AR,  ...... ......  CA... , FL.. ......  LA...  MO... ...... ...... ...... ...... ...... A..... ...... 
                    ...... ia.... ...... ...... ...... ...... ...... LA, NM ...... ...... ...... ...... ...... ...... ...... ...... ...... ...... ...... ...... ...... ...... 
                    ... ...... .. ...... .... ...... ...... , OK,  .... ...... ...... ...... ...... ...... ...... ...... ...... ..... ...... ...... ...... ...... 
                    
                    Alaska Florid Kentuc Missou North  South  Wiscon HHS Re Phoeni Irvine Sunnyv Miami, Des Mo New Or Spring Lincol New Yo Beaver Greenv Housto Ashbur Madiso 
                    ...... a..... ky.... ri.... Caroli Dakota sin... gion 7 x, AZ. , CA.. ale, C  FL... ines,  leans, field, n, NE. rk, NY ton, O ille,  n, TX. n, VA. n, WI. 
                    ...... ...... ...... ...... na.... ...... ......  (IA,  ...... ...... A..... ...... IA....  LA...  MO... ...... ...... R..... SC.... ...... ...... ...... 
                    ...... ...... ...... ...... ...... ...... ...... KS, MO ...... ...... ...... ...... ...... ...... ...... ...... ...... ...... ...... ...... ...... ...... 
                    .. ... .... .... ...... ...... ..... , NE). ...... ...... ...... ..... ...... ...... ...... ...... ...... ...... ...... ...... ...... ...... 
                    
                    Arizon Georgi Louisi Montan North  Tennes Wyomin HHS Re Scotts Los An West H Orland Boise, Boston St Lou Omaha, Roches Eugene Knoxvi Irving Herndo Milwau 
                    a..... a..... ana... a..... Dakota see... g..... gion 8 dale,  geles, ollywo o, FL.  ID... , MA.. is, MO  NE... ter, N , OR.. lle, T , TX.. n, VA. kee, W 
                    ...... ...... ...... ...... ...... ...... ......  (CO,  AZ....  CA... od, CA ...... ...... ...... ...... ...... Y..... ...... N..... ...... ...... I..... 
                    ...... ...... ...... ...... ...... ...... ...... MT, ND ...... ...... ...... ...... ...... ...... ...... ...... ...... ...... ...... ...... ...... ...... 
                    ... ... ..... ... ...... ..... ... , SD,  ...... ...... ...... ...... ..... ...... ...... ..... ...... ...... ...... ...... ...... ...... 
                    
                    Arkans Hawaii Maine. Nebras Ohio.. Texas. HHS Re HHS Re Tempe, Oaklan Colora Tampa, Chicag Somerv Jackso Newark Cincin Portla Memphi Lubboc Norfol ...... 
                    as.... ...... ...... ka.... ...... ...... gion 1 gion 9  AZ... d, CA. do Spr  FL... o, IL. ille,  n, MS. , NJ.. nati,  nd, OR s, TN. k, TX. k, VA. ...... 
                    ...... ...... ...... ...... ...... ......  (CT,   (AZ,  ...... ...... ings,  ...... ...... MA.... ...... ...... OH.... ...... ...... ...... ...... ...... 
                    ...... ...... ...... ...... ...... ...... ME, MA CA, HI ...... ...... CO.... ...... ...... ...... ...... ...... ...... ...... ...... ...... ...... .. 
                    .... .. . ....  . , NH,  , NV). ..... ...... ...... ..... ...... ...... ...... ...... ...... ...... ...... ...... ......  
                    
                    Kalifo Idaho. Maryla Nevada Oklaho Utah.. HHS Re HHS Re Tucson Sacram Denver Atlant Harwoo Baltim Cary,  Albuqu Clevel Philad Nashvi Plano, Reston ...... 
                    rnien. ...... nd.... ...... ma.... ...... gion 2 gion 1 , AZ.. ento,  , CO.. a, GA. d Heig ore, M NC.... erque, and, O elphia lle, T  TX... , VA.. ...... 
                    ...... ...... ...... ...... ...... ......  (NJ,  0 (AK, ...... CA.... ...... ...... hts, I D..... ......  NM... H..... , PA.. N..... ...... ...... ...... 
                    ...... ...... ...... ...... ...... ...... NY)...  ID, O ...... ...... ...... ...... L..... ...... ...... ...... ...... ...... ...... ...... ...... .. 
                    ...... . .... .. ....  ...... R, WA) ...... ...... ...... ...... ...... ...... .... ...... ...... ...... ...... ..... ......  
                    
                    Colora Illino Massac New Ha Oregon Vermon HHS Re Anchor Alamed San Di Washin Norcro Indian Takoma Charlo Las Ve Columb Pittsb Addiso San An Richmo ...... 
                    do.... is.... husett mpshir ...... t..... gion 3 age, A a, CA. ego, C gton,  ss, GA apolis  Park, tte, N gas, N us, OH urgh,  n, TX. tonio, nd, VA ...... 
                    ...... ...... s..... e..... ...... ......  (DE,  K..... ...... A..... DC.... ...... , IN..  MD... C..... V..... ...... PA.... ......  TX... ...... ...... 
                    ...... ...... ...... ...... ...... ...... DC, MD ...... ...... ...... ...... ...... ...... ...... ...... ...... ...... ...... ...... ...... ...... .. 
                    .... .... ...... ...... .. ... , PA,  ...... ...... ...... ...... ...... ...... ...... ...... ...... ...... ...... ...... ...... ......  
                    
                    Connec Indian Michig New Je Pennsy Virgin HHS Re Birmin Berkel San Fr Gaines Roswel Wichit Grand  Durham Reno,  Dayton State  Austin Midval Bellev ...... 
                    ticut. a..... an.... rsey.. lvania ia.... gion 4 gham,  ey, CA ancisc ville, l, GA. a, KS. Rapids , NC.. NV.... , OH.. Colleg , TX.. e, UT. ue, WA ...... 
                    ...... ...... ...... ...... ...... ......  (AL,  AL.... ...... o, CA.  FL... ...... ...... , MI.. ...... ...... ...... e, PA. ...... ...... ...... ...... 
                    ...... ...... ...... ...... ...... ...... FL, GA ...... ...... ...... ...... ...... ...... ...... ...... ...... ...... ...... ...... ...... ...... .. 
                    ...... ... .... ...... ...... .... , KY,  ...... ...... ...... ...... ...... ...... ...... ...... .... ...... ...... ...... ...... ......
                    Attached Files
                    I'm interested in expert panflu damage estimates
                    my current links: http://bit.ly/hFI7H ILI-charts: http://bit.ly/CcRgT

                    Comment


                    • #11
                      Re: season 2012/3 vs. 1999/0

                      I made the computer-readable file cdc12 .

                      It has 448KB , 155KB when compressed with 7-zip in 5860 = 10*586 lines
                      and contains the weekly ILI-data from CDC 1997/8 - 2012/3
                      33+34+33+33+33+33+34+33+33+33+33+48+57+52+52+12=58 6 weeks

                      each line with 16 comma-separated entries:

                      01 HHSregion-1
                      02 season#
                      03 week_in_season
                      04 year
                      05 week
                      06 ILI counts for 0-4 year-old people
                      07 ..5-24y
                      08 ..25-49y , if available - else 0
                      09 ..25-64y
                      10 ..50-64y , if available - else 0
                      11 >64y
                      12 total ILI counts
                      13 patients
                      14 providers
                      15 % ILI unweighted
                      16 % ILI weighted


                      the first line is:
                      0,01,01,1997,40,15,22,0,7,0,0,44,7053,32,0.6238480 07939884,0.49853478965969

                      and the last line is:
                      9,16,12,2012,51,22,24,14,23,09,06,75,4107,23,1.826 15,2.702119

                      it has DOS/Windows style cr/lf at the line-end, that can easily be
                      converted to UNIX/Linux style lf .

                      ----------------------------------------------
                      when comparing CDC-data with google flu-trends, it seems
                      that google-data becomes a bit inflated over the time.
                      Maybe that's because more people are using google now
                      than in 2003 and they don't correct for this.
                      So the actual season is probably not as bad as google charts suggest.
                      The CDC ILI-% is lower, but also ~1week back.
                      The peak in the first stated was a bit confirmed today
                      Attached Files
                      I'm interested in expert panflu damage estimates
                      my current links: http://bit.ly/hFI7H ILI-charts: http://bit.ly/CcRgT

                      Comment


                      • #12
                        Re: season 2012/3 vs. 1999/0

                        Alabama is up:


                        no peak yet in week 50/51

                        that makes me wonder about the google-"peaks" in MS,TN,GA,NC
                        I'm interested in expert panflu damage estimates
                        my current links: http://bit.ly/hFI7H ILI-charts: http://bit.ly/CcRgT

                        Comment


                        • #13
                          Re: season 2012/3 vs. 1999/0

                          the US-military keeps her own flu surveillance system


                          they say it's up in week 52 and outpatient or RME
                          visits seem to show this, but the chart of total
                          ILI incidence of "people at risk" doesn't show anything,
                          even going down since week 40.
                          Whether vaccinated or not

                          regions : EUCOM and PACOM
                          populations : service members and other beneficiaries

                          week1:


                          actual week: http://www.afhsc.mil/viewFlu?file=dodWeekly.pdf
                          Attached Files
                          I'm interested in expert panflu damage estimates
                          my current links: http://bit.ly/hFI7H ILI-charts: http://bit.ly/CcRgT

                          Comment


                          • #14
                            Re: season 2012/3 vs. 1999/0

                            Google has Connecticut heading back up.
                            Google.org connects nonprofits to funding & additional resources. Learn about our philanthropy program & goal to aid underserved communities.

                            Comment


                            • #15
                              Re: season 2012/3 vs. 1999/0

                              but not much
                              and the others are still going down, even more than yesterday

                              how reliable is google ?

                              we should have examined that already...
                              I'm interested in expert panflu damage estimates
                              my current links: http://bit.ly/hFI7H ILI-charts: http://bit.ly/CcRgT

                              Comment

                              Working...
                              X