Check out the FAQ,Terms of Service & Disclaimers by clicking the
link. Please register
to be able to post. By viewing this site you are agreeing to our Terms of Service and Acknowledge our Disclaimers.
FluTrackers.com Inc. does not provide medical advice. Information on this web site is collected from various internet resources, and the FluTrackers board of directors makes no warranty to the safety, efficacy, correctness or completeness of the information posted on this site by any author or poster.
The information collated here is for instructional and/or discussion purposes only and is NOT intended to diagnose or treat any disease, illness, or other medical condition. Every individual reader or poster should seek advice from their personal physician/healthcare practitioner before considering or using any interventions that are discussed on this website.
By continuing to access this website you agree to consult your personal physican before using any interventions posted on this website, and you agree to hold harmless FluTrackers.com Inc., the board of directors, the members, and all authors and posters for any effects from use of any medication, supplement, vitamin or other substance, device, intervention, etc. mentioned in posts on this website, or other internet venues referenced in posts on this website.
We are not asking for any donations. Do not donate to any entity who says they are raising funds for us.
Announcement
Collapse
No announcement yet.
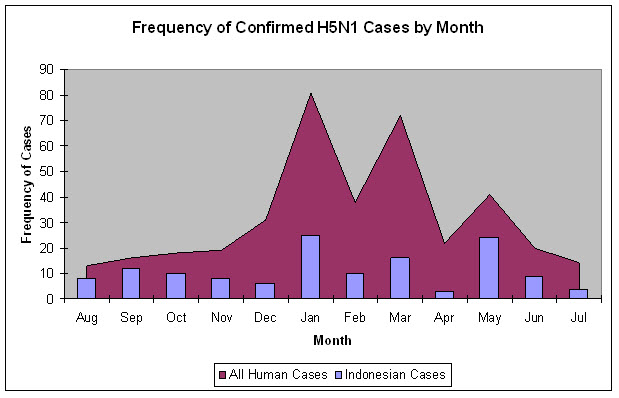
Chart - Human Cases of H5N1 by Month as of August 2008
Chart - Human Cases of H5N1 by Month as of August 2008
The following graph shows the frequency of 385 WHO confirmed human cases by month and the number of human cases in Indonesia by month. The graph runs from August to July and is roughly correlated with the flu season in the northern hemisphere.
Based on this past data we should expect to see an increase in human H5N1 cases in the next 30-45 days. It is not clear that such cases will be officially acknowledged or reported.
 Tweet
Tweet
Comment