SuperNova1987A
Moderator
Re: Aso calls for calm response as new flu infections reach 1023 in Japan
Re: Aso calls for calm response as new flu infections reach 1023 in Japan
Hi, Commonground,
Thank you for your comment. Let me share with you my thought about age distribution of patients in Japan.
Yes. According to the current age distribution, 50% of all cases are in their teens. (See the above graph)
Percentage of teenagers is, however, declining these days and, in my opinion, will decline further until it reaches around 40%. Then, percentages of (1) less than 10 yo, (2) twenties and (3) the remaining age groups together will be all around 20%. The following is the reason.
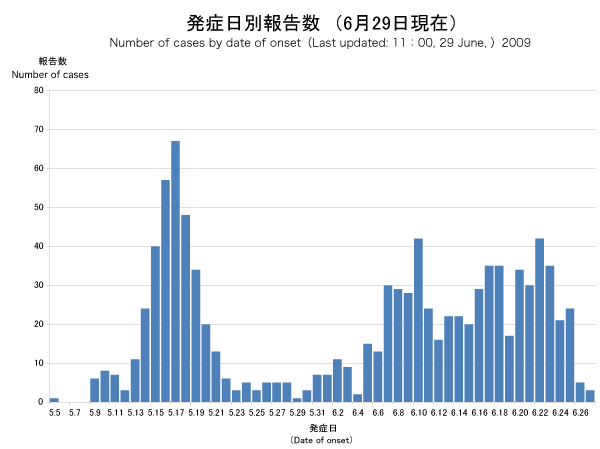
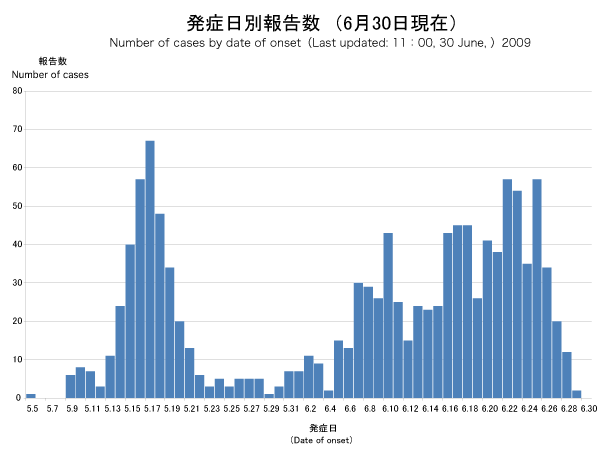
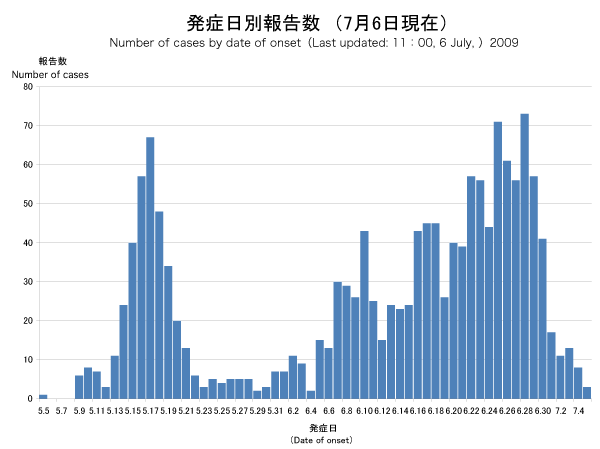
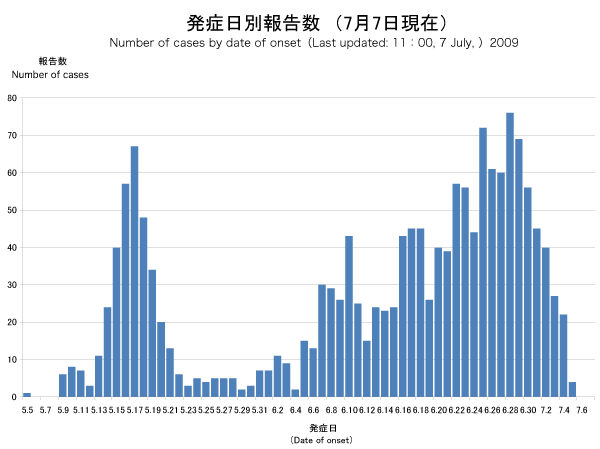
Novel flu outbreaks started in Japan with big high-school outbreaks in Hyogo and Osaka in the middle of May. At that time almost all the patients were teenagers, high-school students. Consequently, age distribution by the end of May was like in the graph 1.
GRAPH 1
View attachment 3583
Since the end of May when the big high-school outbreaks subsided, school infections have started in a dozen of schools and sometimes spread to nearby schools but, in each case, measures were taken relatively quickly to prevent widespread infections. (Lessons learnt from Hyogo and Osaka)
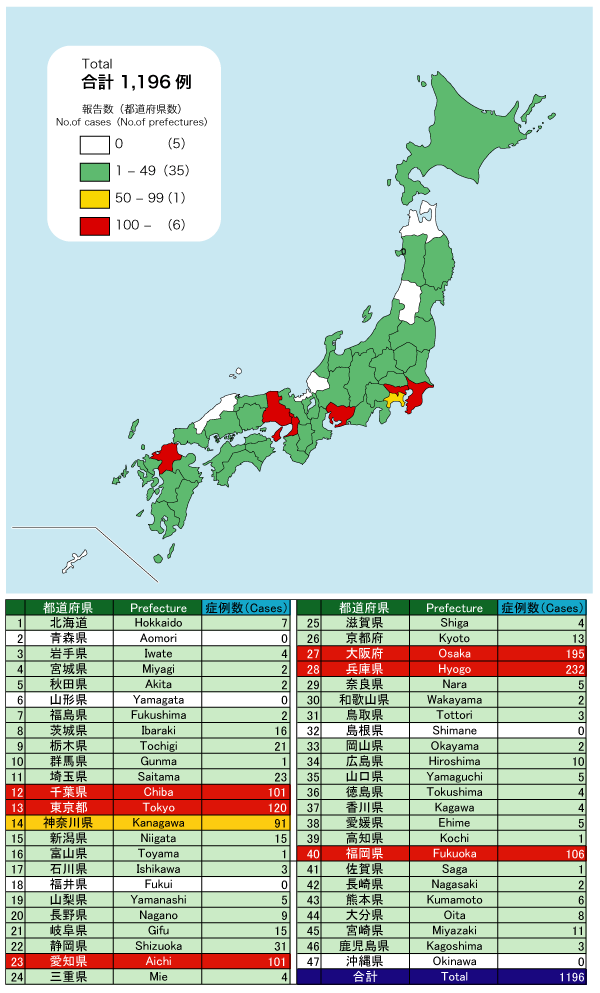
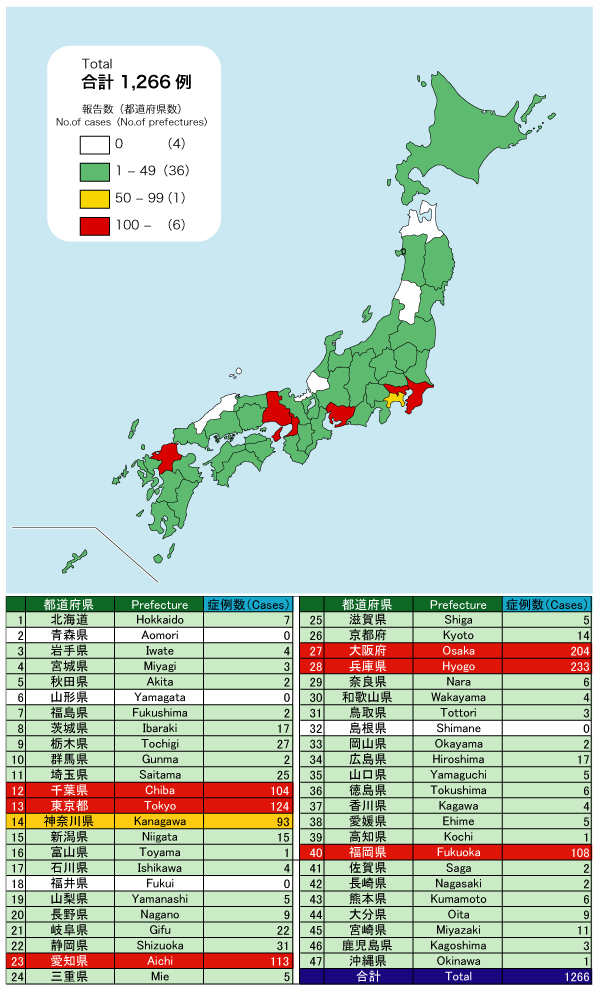
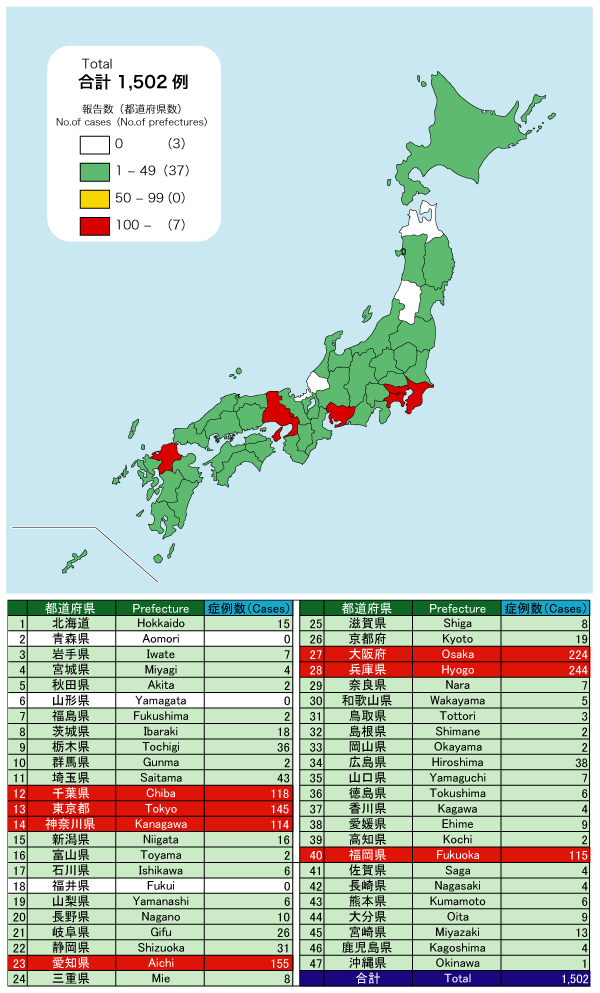
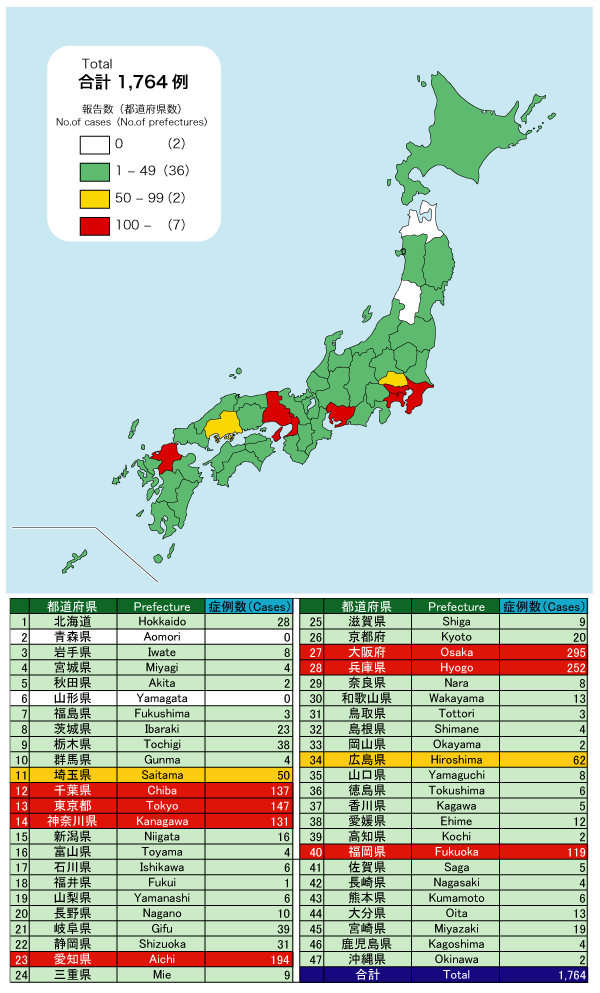
In the meantime, travel-related infections, mainly from USA, especially from Hawaii, have been discovered in various parts of Japan but didn?t cause big outbreaks, except in Fukuoka where about 100 school infections were traced back to a patient from USA. In other cases of travel-related infections, patients other than teenagers are common as compared to school infections.
Recently, there are more clasters of patients in various parts of Japan for which no source of infection can be traced. Again, those patients are from various age groups.
The above trend of novel flu infections in Japan has been there for about one and half months and seems to continue in the future, maybe until the next influenza season starts in October. Thus, age distribution of patients in the future will look like the graph 2, showing age distribution of patients from the end of May until now.
GRAPH 2
View attachment 3584
_________________
SN1987A
Re: Aso calls for calm response as new flu infections reach 1023 in Japan
Hi, Commonground,
Thank you for your comment. Let me share with you my thought about age distribution of patients in Japan.
Yes. According to the current age distribution, 50% of all cases are in their teens. (See the above graph)
Percentage of teenagers is, however, declining these days and, in my opinion, will decline further until it reaches around 40%. Then, percentages of (1) less than 10 yo, (2) twenties and (3) the remaining age groups together will be all around 20%. The following is the reason.
Novel flu outbreaks started in Japan with big high-school outbreaks in Hyogo and Osaka in the middle of May. At that time almost all the patients were teenagers, high-school students. Consequently, age distribution by the end of May was like in the graph 1.
GRAPH 1
View attachment 3583
Since the end of May when the big high-school outbreaks subsided, school infections have started in a dozen of schools and sometimes spread to nearby schools but, in each case, measures were taken relatively quickly to prevent widespread infections. (Lessons learnt from Hyogo and Osaka)
In the meantime, travel-related infections, mainly from USA, especially from Hawaii, have been discovered in various parts of Japan but didn?t cause big outbreaks, except in Fukuoka where about 100 school infections were traced back to a patient from USA. In other cases of travel-related infections, patients other than teenagers are common as compared to school infections.
Recently, there are more clasters of patients in various parts of Japan for which no source of infection can be traced. Again, those patients are from various age groups.
The above trend of novel flu infections in Japan has been there for about one and half months and seems to continue in the future, maybe until the next influenza season starts in October. Thus, age distribution of patients in the future will look like the graph 2, showing age distribution of patients from the end of May until now.
GRAPH 2
View attachment 3584
_________________
SN1987A