Shiloh
Editor, Senior Moderator
Re: Canada Suspected/Confirmed Swine Flu Cases April 26 +
Re: Canada Suspected/Confirmed Swine Flu Cases April 26 +
Source: http://www.phac-aspc.gc.ca/alert-alerte/swine-porcine/surveillance-eng.php
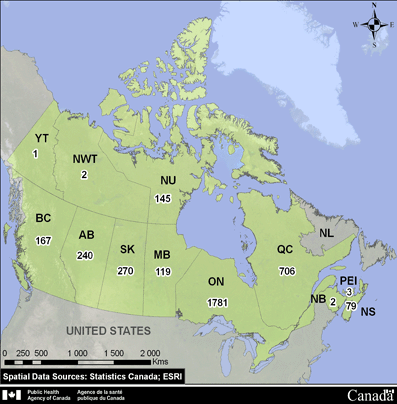
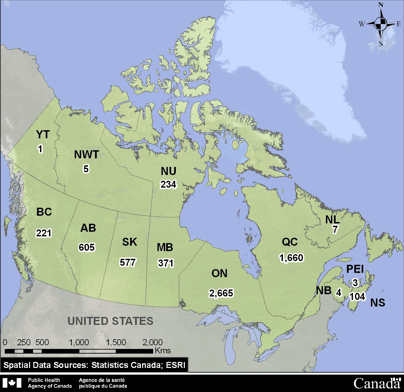
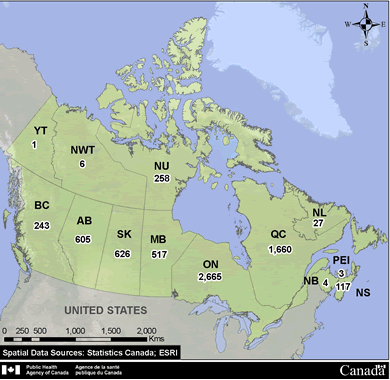
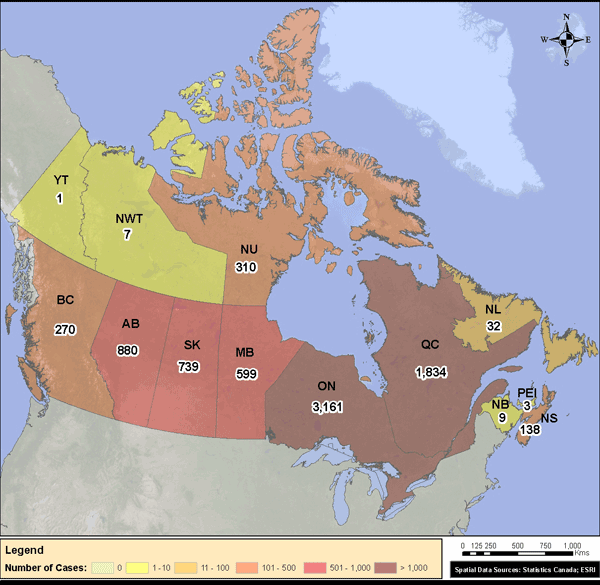
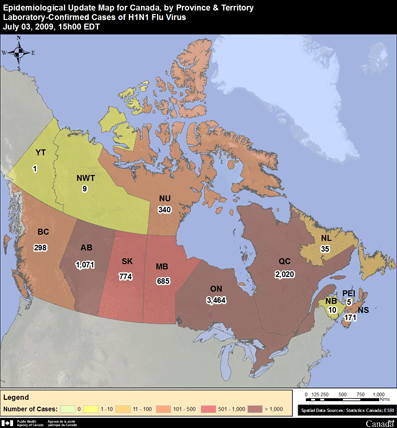
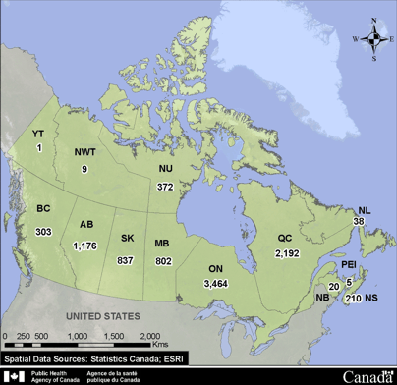
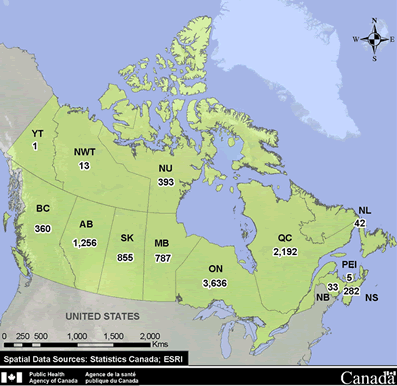
Epidemiological Update Map for Canada, by Province & Territory
Laboratory-Confirmed Cases of H1N1 Flu Virus
June 08, 2009, 15h00 EDT

As of June 8 2009, a total of 2,446 laboratory-confirmed cases of H1N1 flu virus have been reported in all provinces and territories in Canada except Newfoundland (see Table 1 below).
********************************************
Table 1: Summary of laboratory-confirmed cases of H1N1 flu virus reported to the Public Health Agency of Canada, by the provinces and territories as of June 8, 2009 at 15:00 EDT.
Province / Territory NEW Laboratory-Confirmed Cases reported since June 5, 2009(1) TOTAL Laboratory-confirmed Cases (including today?s cases) (2)Total Deaths
British Columbia 3 145 0
Alberta 22 172 1
Saskatchewan 31 210 0
Manitoba 0 40 0
Ontario 145 1223 2
Quebec 110 547 1
New Brunswick 0 2 0
Nova Scotia 1 76 0
Prince Edward Island 0 3 0
Newfoundland 0 0 0
Yukon 0 1 0
Northwest Territories 0 2 0
Nunavut 19 25 0
Total 331 2446 4
(1) Note: P/Ts may choose to announce cases that have been confirmed after 15:00 EDT.
These cases will be reflected in the next epidemiological update.
(2) Number of deaths is included in the number of cases
******************************
To date 121 hospitalizations and four deaths have been reported among laboratory-confirmed cases. The most recent date of symptom onset is June 2nd, 2009.
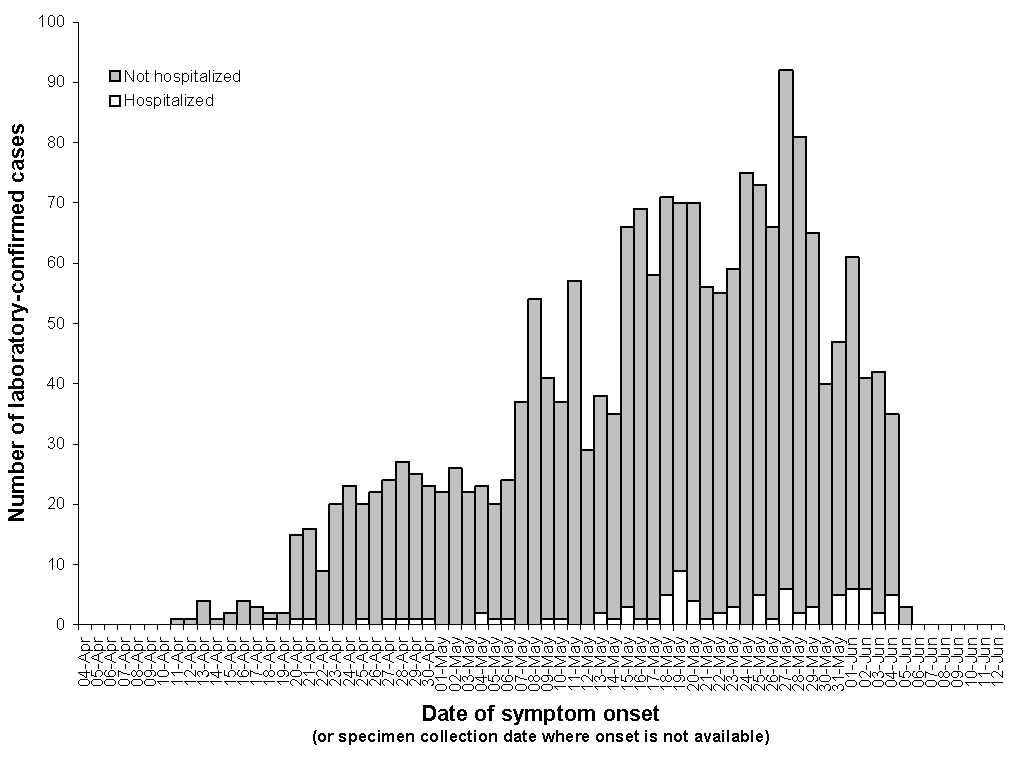
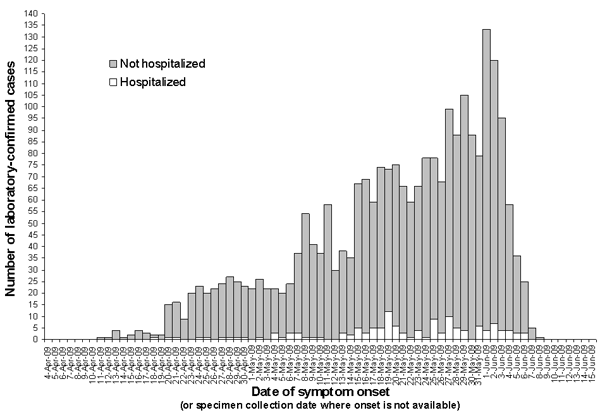
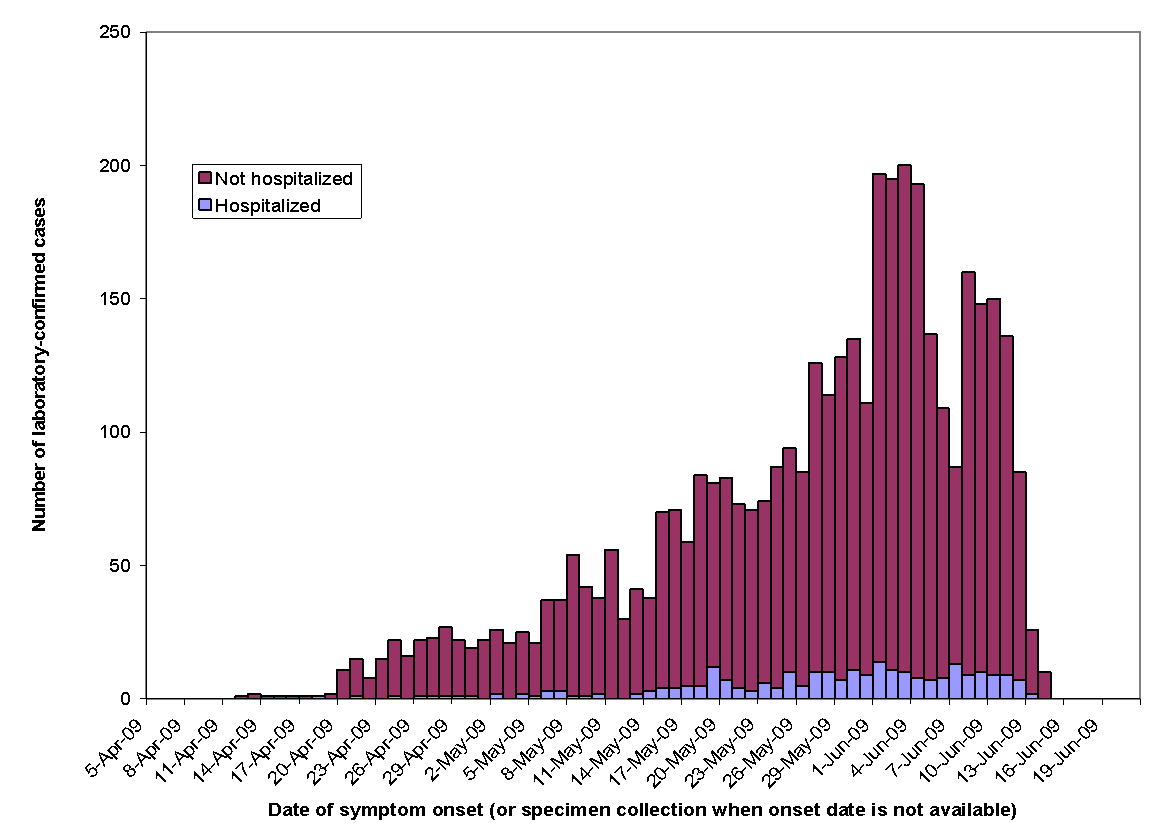
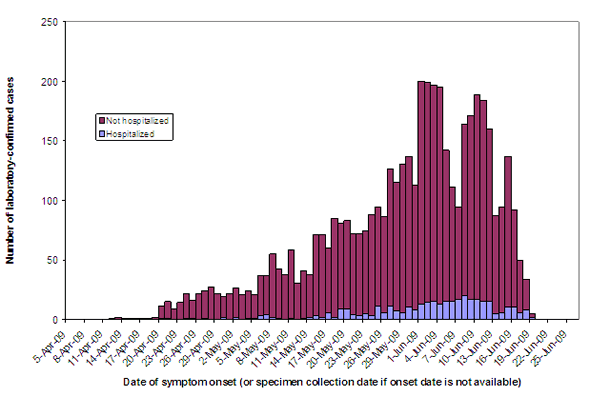
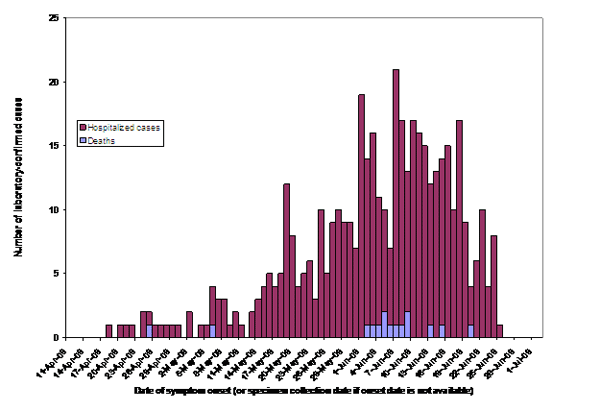
The following graph, also known as an epidemic curve, is up to date as of June 5, 2009. The graph illustrates the course of the current H1N1 flu virus outbreak in Canada. It shows either the date when symptoms of H1N1 flu virus began or, if this date was not available, the date when a specimen was collected, for each of the laboratory-confirmed cases.
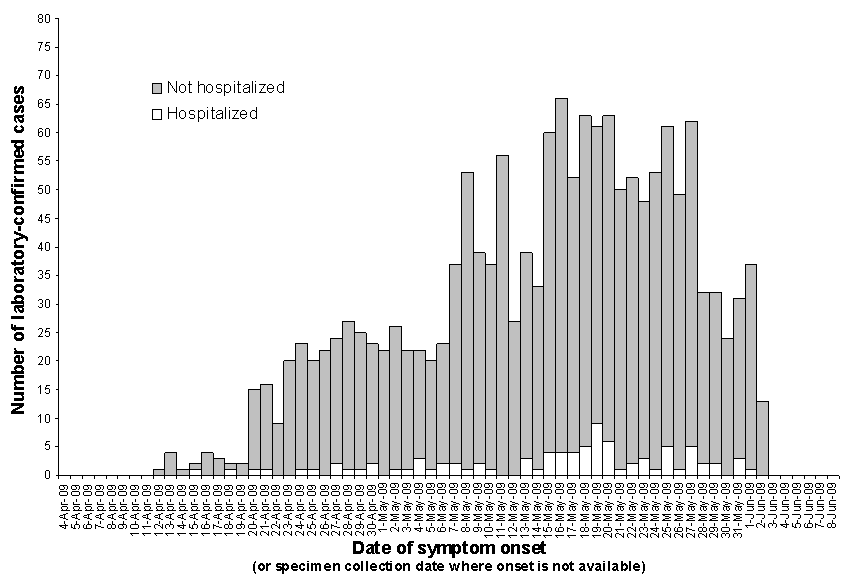
Figure 1. Number of laboratory-confirmed H1N1 flu virus cases in Canada by date of onset (or specimen collection date where onset date is not available) as reported to the Public Health Agency of Canada as of 5 June 2009 15:00 EDT (N=1,608).
Source: Provincial/Territorial Ministries of Health
When interpreting the graph, it should be noted that:
* The graph is prepared retrospectively and is updated daily using the information available at that time. It is not as current as Table 1 that contains the summary of laboratory-confirmed cases, as information about the date of onset of symptoms takes more time to compile.
* There is always a delay from the date that an illness starts to the date the case is reported to public health authorities. This delay is the result of the time required for patients to see their physicians, laboratory testing to be completed, and results to be communicated to public health authorities.
Re: Canada Suspected/Confirmed Swine Flu Cases April 26 +
Source: http://www.phac-aspc.gc.ca/alert-alerte/swine-porcine/surveillance-eng.php
Epidemiological Update Map for Canada, by Province & Territory
Laboratory-Confirmed Cases of H1N1 Flu Virus
June 08, 2009, 15h00 EDT
As of June 8 2009, a total of 2,446 laboratory-confirmed cases of H1N1 flu virus have been reported in all provinces and territories in Canada except Newfoundland (see Table 1 below).
********************************************
Table 1: Summary of laboratory-confirmed cases of H1N1 flu virus reported to the Public Health Agency of Canada, by the provinces and territories as of June 8, 2009 at 15:00 EDT.
Province / Territory NEW Laboratory-Confirmed Cases reported since June 5, 2009(1) TOTAL Laboratory-confirmed Cases (including today?s cases) (2)Total Deaths
British Columbia 3 145 0
Alberta 22 172 1
Saskatchewan 31 210 0
Manitoba 0 40 0
Ontario 145 1223 2
Quebec 110 547 1
New Brunswick 0 2 0
Nova Scotia 1 76 0
Prince Edward Island 0 3 0
Newfoundland 0 0 0
Yukon 0 1 0
Northwest Territories 0 2 0
Nunavut 19 25 0
Total 331 2446 4
(1) Note: P/Ts may choose to announce cases that have been confirmed after 15:00 EDT.
These cases will be reflected in the next epidemiological update.
(2) Number of deaths is included in the number of cases
******************************
To date 121 hospitalizations and four deaths have been reported among laboratory-confirmed cases. The most recent date of symptom onset is June 2nd, 2009.
The following graph, also known as an epidemic curve, is up to date as of June 5, 2009. The graph illustrates the course of the current H1N1 flu virus outbreak in Canada. It shows either the date when symptoms of H1N1 flu virus began or, if this date was not available, the date when a specimen was collected, for each of the laboratory-confirmed cases.
Figure 1. Number of laboratory-confirmed H1N1 flu virus cases in Canada by date of onset (or specimen collection date where onset date is not available) as reported to the Public Health Agency of Canada as of 5 June 2009 15:00 EDT (N=1,608).
Source: Provincial/Territorial Ministries of Health
When interpreting the graph, it should be noted that:
* The graph is prepared retrospectively and is updated daily using the information available at that time. It is not as current as Table 1 that contains the summary of laboratory-confirmed cases, as information about the date of onset of symptoms takes more time to compile.
* There is always a delay from the date that an illness starts to the date the case is reported to public health authorities. This delay is the result of the time required for patients to see their physicians, laboratory testing to be completed, and results to be communicated to public health authorities.